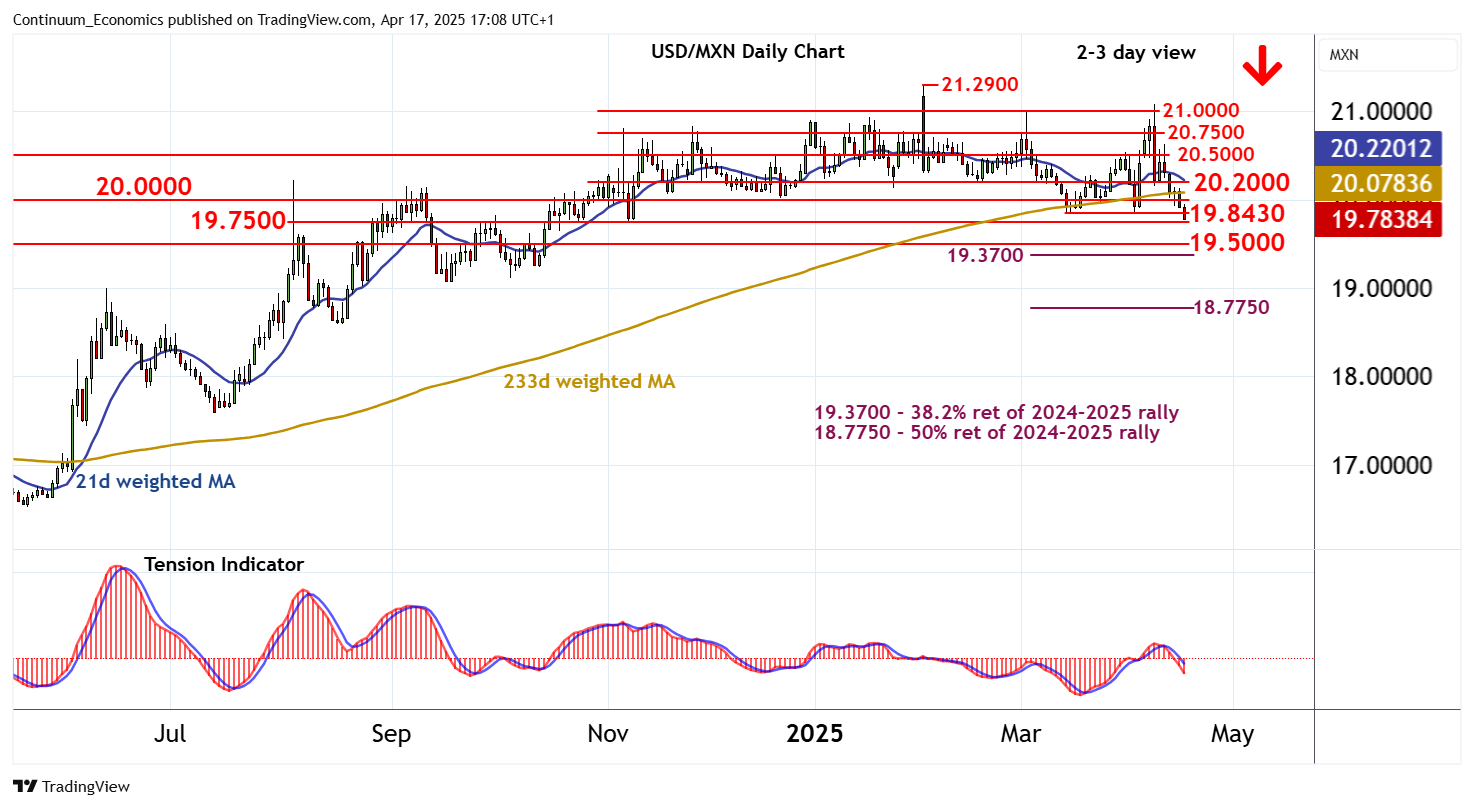
Chart USD/MXN Update: Pressuring critical support

Steady selling interest has reached critical support at the 19.7500 break level and the 19.8430 monthly low of 14 March
| Levels | Imp | Comment | Levels | Imp | Comment | |||
|---|---|---|---|---|---|---|---|---|
| R4 | 20.7500 | ** | congestion | S1 | 19.8430 | ** | 14 Mar (m) low | |
| R3 | 20.5000 | * | congestion | S2 | 19.7500 | * | break level | |
| R2 | 20.2000 | break level | S3 | 19.5000 | * | congestion | ||
| R1 | 20.0000 | * | congestion | S4 | 19.3700 | ** | 38.2% ret of 2024-2025 rally |
Asterisk denotes strength of level
17:00 BST - Steady selling interest has reached critical support at the 19.7500 break level and the 19.8430 monthly low of 14 March. Daily readings are under pressure and broader weekly charts are also bearish, highlighting room for further losses in the coming sessions. A close below here will confirm a significant high in place at the 21.2900 current year high of 3 February, and extend February losses initially to congestion around 19.5000. Beneath here is the 19.3700 Fibonacci retracement. Meanwhile, resistance is lowered to congestion around 20.0000 and extends to 20.2000. A close above here, if seen, would help to stabilise price action and prompt consolidation beneath further congestion around 20.5000.