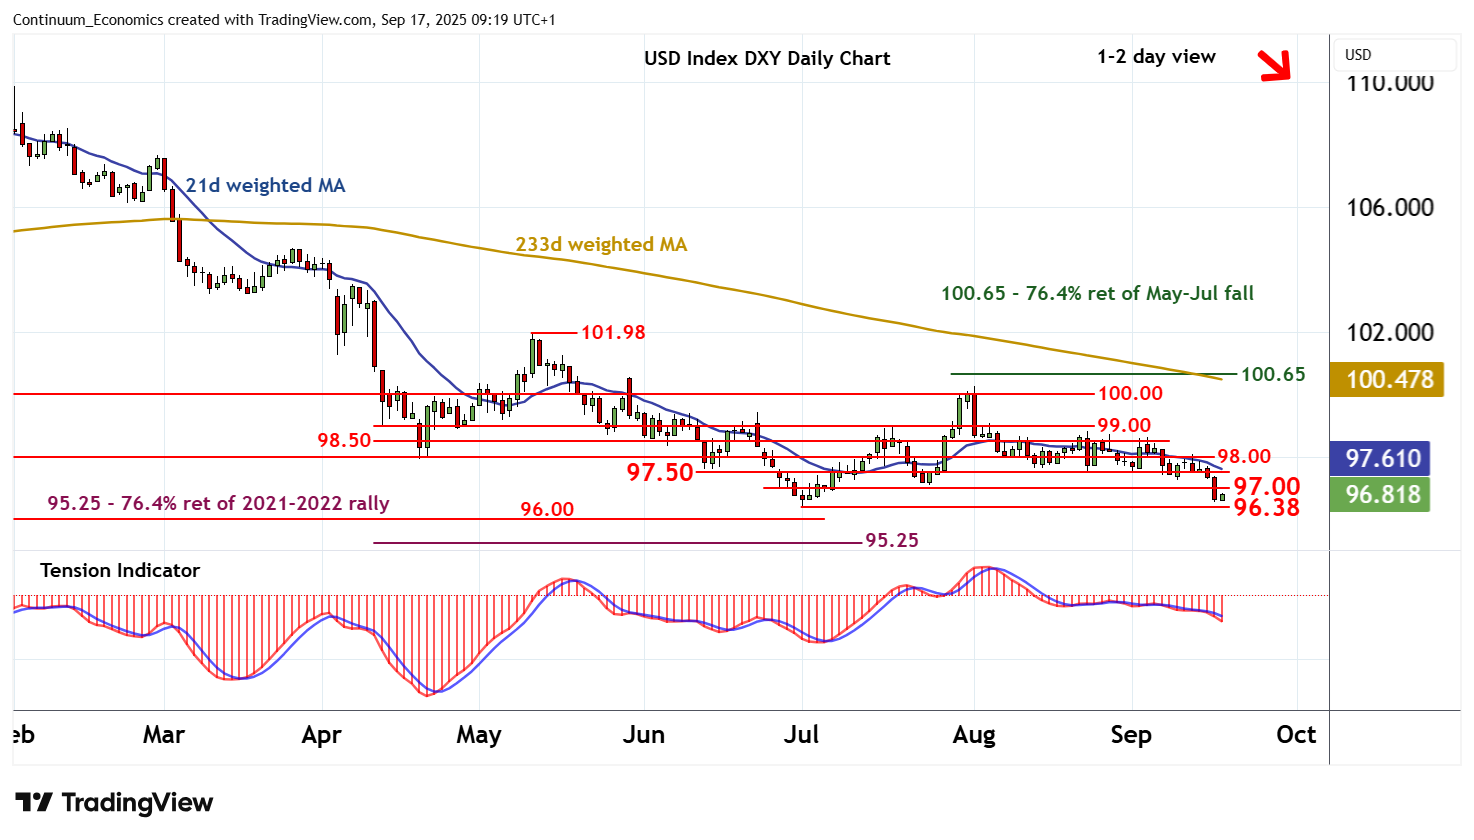
Chart USD Index DXY Update: Approaching the 96.38 current year low
The anticipated break below 97.00 has reached 96.55
| Levels | Imp | Comment | Levels | Imp | Comment | |||
|---|---|---|---|---|---|---|---|---|
| R4 | 98.50 | congestion | S1 | 96.55 | 16 Sep low | |||
| R3 | 98.00 | * | congestion | S2 | 96.38 | ** | 1 Jul YTD low | |
| R2 | 97.50 | * | congestion | S3 | 96.00 | * | historic congestion | |
| R1 | 97.00 | * | congestion | S4 | 95.25 | ** | 76.4% ret of 2021-2022 rally |
Asterisk denotes strength of level
09:10 BST - The anticipated break below 97.00 has reached 96.55, where unwinding oversold intraday studies are prompting short-term reactions. Immediate focus is back on congestion resistance at 97.00. But negative daily readings and deteriorating weekly charts are expected to limit any tests in renewed selling interest. Following cautious trade, August losses are expected to resume. A break below 96.55 will open up critical support at the 96.38 current year low of 1 July. A close beneath here would confirm a more significant bear trend, as January losses then focus on the 95.25 Fibonacci retracement. Meanwhile, a close above 97.00, if seen, will help to stabilise price action and give way to consolidation beneath further congestion around 97.50.