Chart GBP/USD Update: Leaning lower in range
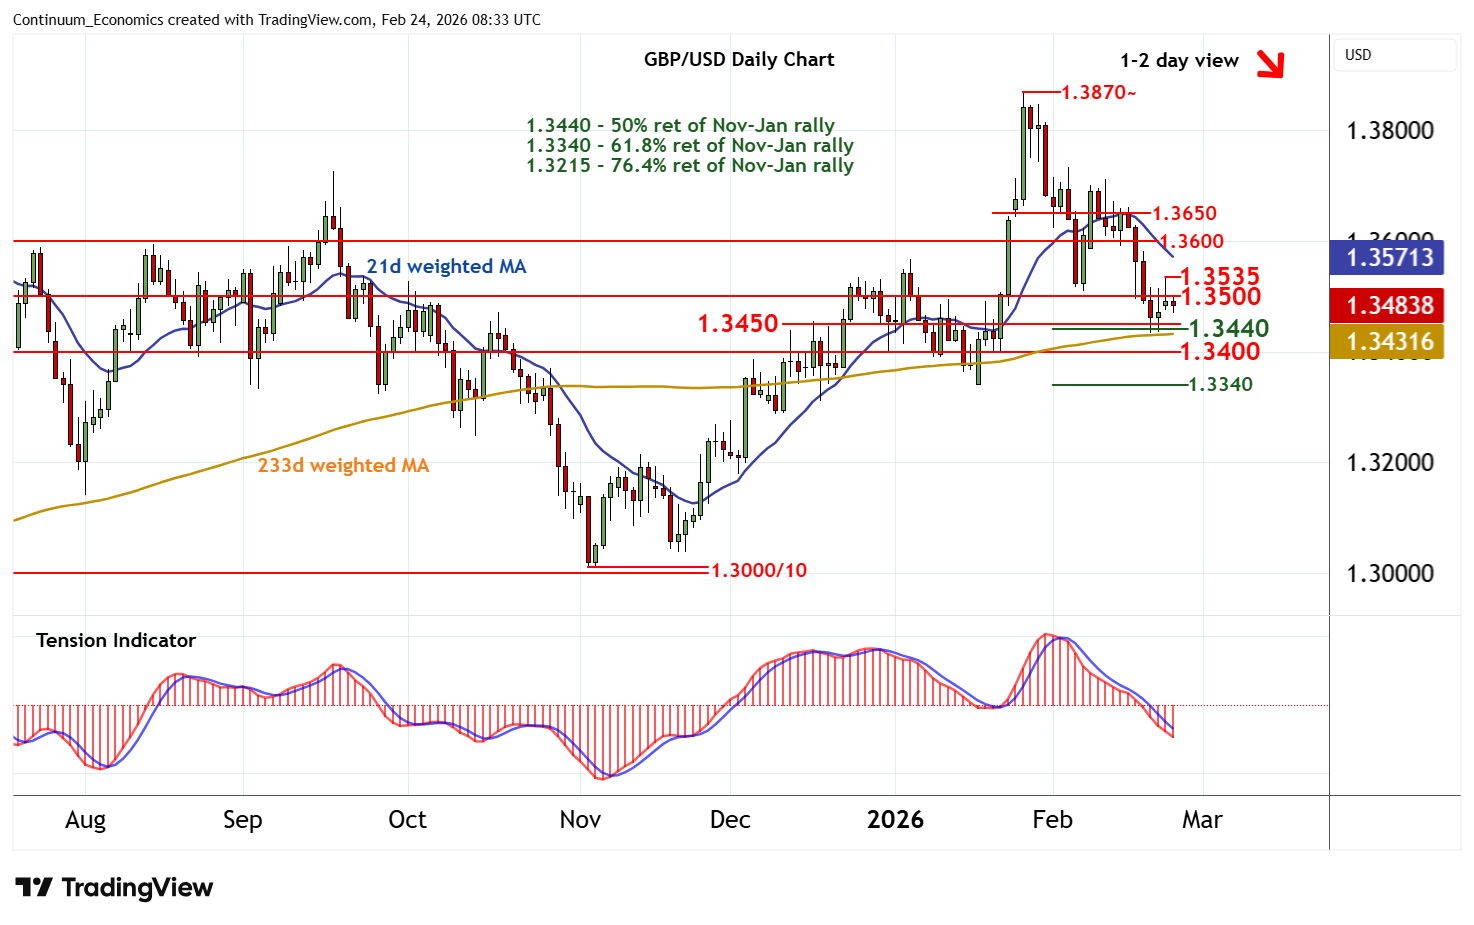
Minor gains have met selling interest around 1.3535
| Level | Comment | Level | Comment | |||||
|---|---|---|---|---|---|---|---|---|
| R4 | 1.3650 | * | break level | S1 | 1.3440/50 | ** | 50% ret; congestion | |
| R3 | 1.3600 | * | congestion | S2 | 1.3400 | ** | congestion | |
| R2 | 1.3535 | 23 Feb high | S3 | 1.3340 | ** | 61.8% ret of Nov-Jan rally | ||
| R1 | 1.3500 | ** | congestion | S4 | 1.3300 | ** | congestion |
Asterisk denotes strength of level
08:10 GMT - Minor gains have met selling interest around 1.3535, as intraday studies turn down, with renewed selling interest pushing prices back to 1.3490. Oversold daily stochastics are flat, suggesting room for consolidation above support at the 1.3440 Fibonacci retracement and congestion around 1.3450. But the daily Tension Indicator remains bearish and broader weekly charts are also negative, highlighting potential for further losses. A later close beneath here will add weight to sentiment and extend late-January losses towards congestion around 1.3400. Continuation towards the 1.3340 retracement cannot be ruled out. Meanwhile, an unexpected close above the 1.3535 high of 23 February will improve price action and extend (corrective) gains towards congestion around 1.3600.