Chart USD/ZAR Update: Edging higher
Still little change, as overbought intraday studies keep near-term sentiment cautious
| Level | Comment | Level | Comment | |||||
|---|---|---|---|---|---|---|---|---|
| R4 | 18.1525 | ** | 19 Jun (m) high | S1 | 17.5000 | ** | congestion | |
| R3 | 18.0000 | ** | congestion | S2 | 17.4690 | ** | 4 Jul YTD low | |
| R2 | 17.8000 | * | congestion | S3 | 17.2500 | ** | 7 Nov (m) low | |
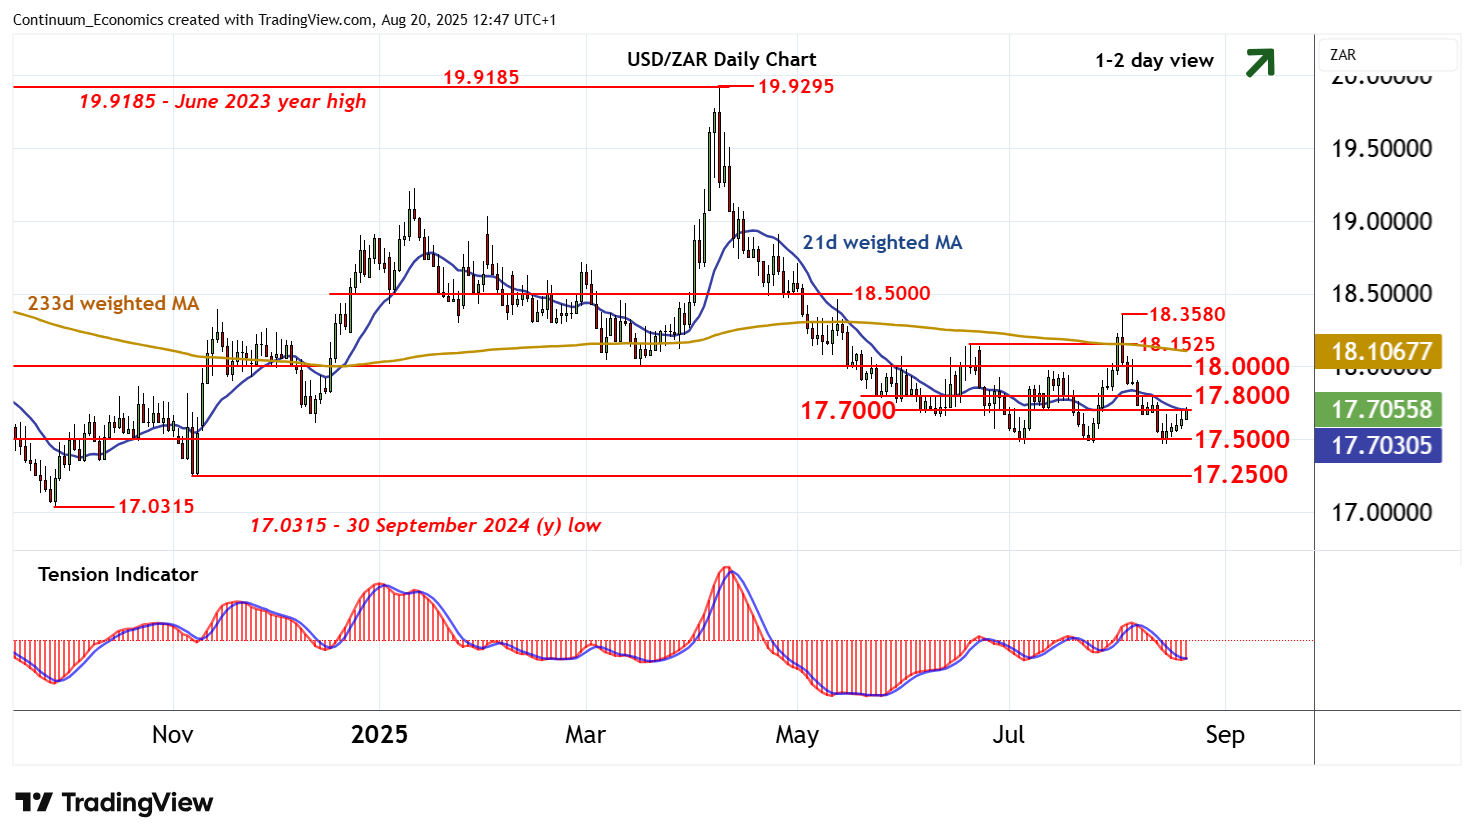
| R1 | 17.7000 | * | congestion | S4 | 17.0315 | ** | 30 Sep 2024 (y) low |
Asterisk denotes strength of level
12:30 BST - Still little change, as overbought intraday studies keep near-term sentiment cautious and extend consolidation around congestion resistance at 17.7000. Oversold daily stochastics are unwinding and the flat daily Tension Indicator is edging higher, suggesting room for continuation towards further congestion around 17.8000. However, negative weekly charts are expected to limit any immediate break above here in renewed selling interest interest beneath 18.0000. Meanwhile, support remains at congestion around 17.5000 and extends to the 17.4690 current year low of 4 July. This range should underpin any immediate setbacks.