Published: 2025-10-27T00:23:17.000Z
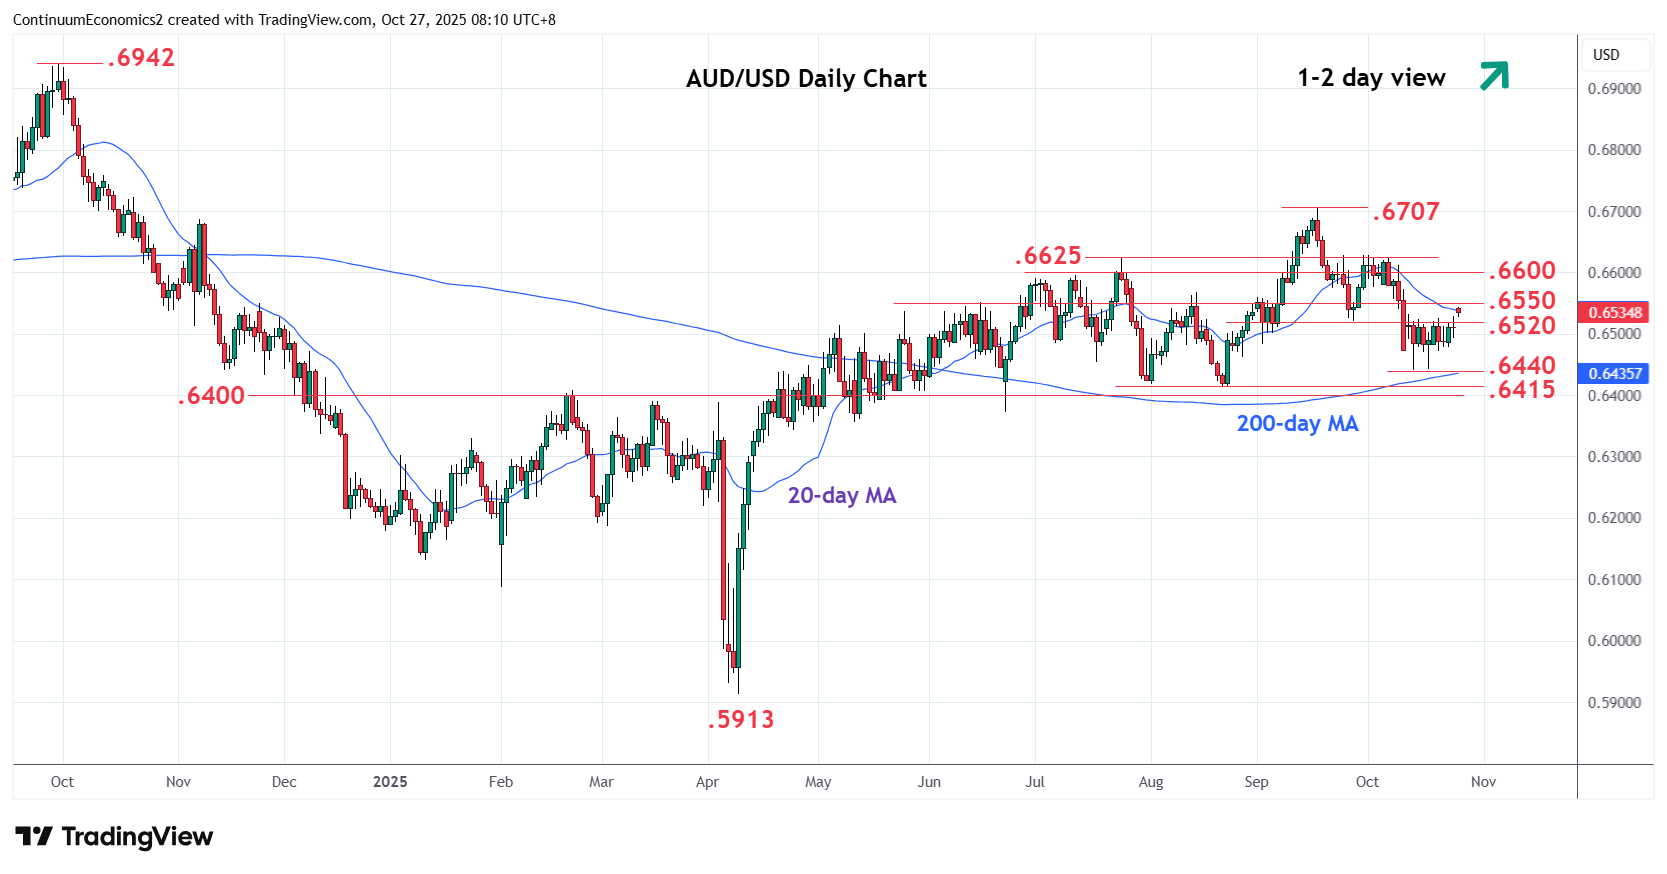
Chart AUD/USD Update: Extending bounce from .6440 low
-
Gapped up at the open above the .6520 resistance see prices extending bounce from the .6440 low
| Levels | Imp | Comment | Levels | Imp | Comment | |||
|---|---|---|---|---|---|---|---|---|
| R4 | 0.6660 | 18 Sep high | S1 | 0.6500 | * | congestion | ||
| R3 | 0.6625 | ** | Jul high, congestion | S2 | 0.6470 | * | 10 Oct low | |
| R2 | 0.6600 | * | congestion | S3 | 0.6440 | ** | 14 Oct low | |
| R1 | 0.6550 | * | congestion | S4 | 0.6415/00 | ** | Aug low, 38.2% |
Asterisk denotes strength of level
00:10 GMT - Gapped up at the open above the .6520 resistance see prices extending bounce from the .6440 low to retrace losses .6707, September current year high. Nearby see resistance at .6550 congestion. Clearance here will open up room for stronger gains to retest strong resistance at the .6600/25 area where reaction can be expected. Break here, if seen, will return focus to the .6707 high. Meanwhile, support is raised to the .6520/00 congestion area which should underpin and sustain bounce from the .6440 low.