Published: 2026-01-28T06:52:35.000Z
Chart USD Index DXY Update: Still weak
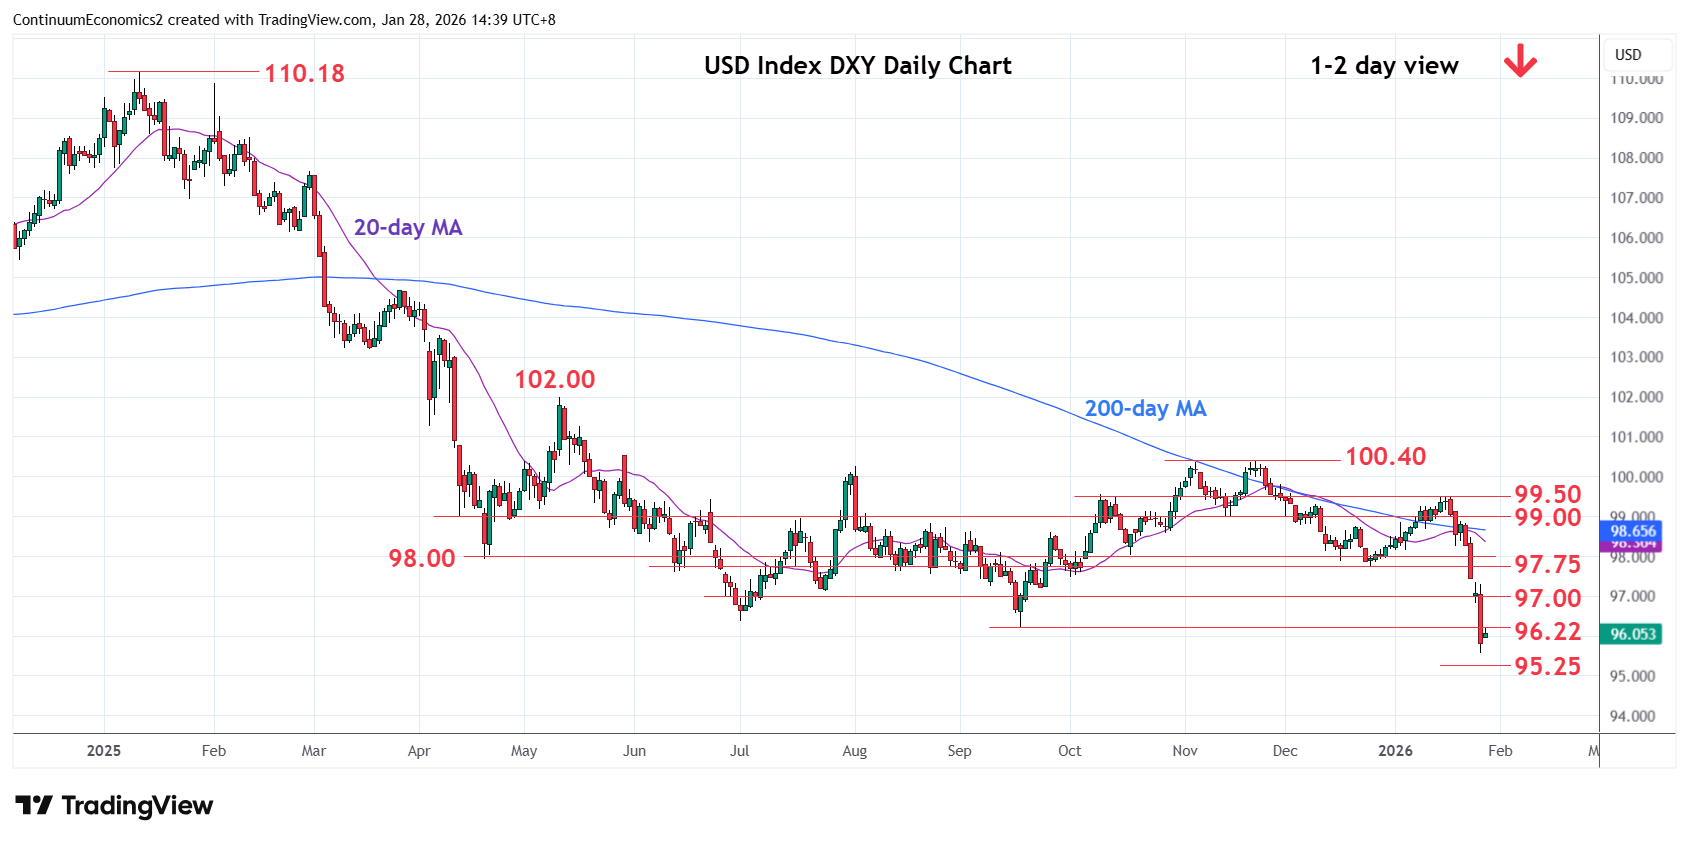
3
Turned up from the 95.55 low as prices consolidate sharp losses from the 99.50 high of last week
| Levels | Imp | Comment | Levels | Imp | Comment | |||
|---|---|---|---|---|---|---|---|---|
| R4 | 98.00 | ** | congestion | S1 | 95.25 | * | 76.4% 2021/2022 rally | |
| R3 | 97.75 | * | Dec low, congestion | S2 | 95.00 | * | congestion | |
| R2 | 97.00 | * | congestion | S3 | 94.63 | * | Jan 2022 year low | |
| R1 | 96.22 | ** | Sep 2025 year low | S4 | 94.50/00 | * | congestion |
Asterisk denotes strength of level
06:45 GMT - Turned up from the 95.55 low as prices consolidate sharp losses from the 99.50 high of last week. Bounce see prices unwinding oversold intraday and daily studies but bearish momentum suggest room for further losses later. Lower will see room to the nearby support at 95.25/95.00, 76.4% Fibonacci level and congestion area. Lower still, will see continuation to the 2022 year low at 94.63 then the 94.50/94.00 congestion. Meanwhile, resistance is lowered to the 96.22/97.00, September 2025 year low and congestion area, which area expected to cap.