Chart GBP/USD Update: Smart bounce from early losses - studies under pressure

The early break below support at the 1.2860 lows from 6-10 March has bounced from 1.2825~
| Level | Comment | Level | Comment | |||||
|---|---|---|---|---|---|---|---|---|
| R4 | 1.3275 | * | congestion | S1 | 1.2900 | ** | congestion | |
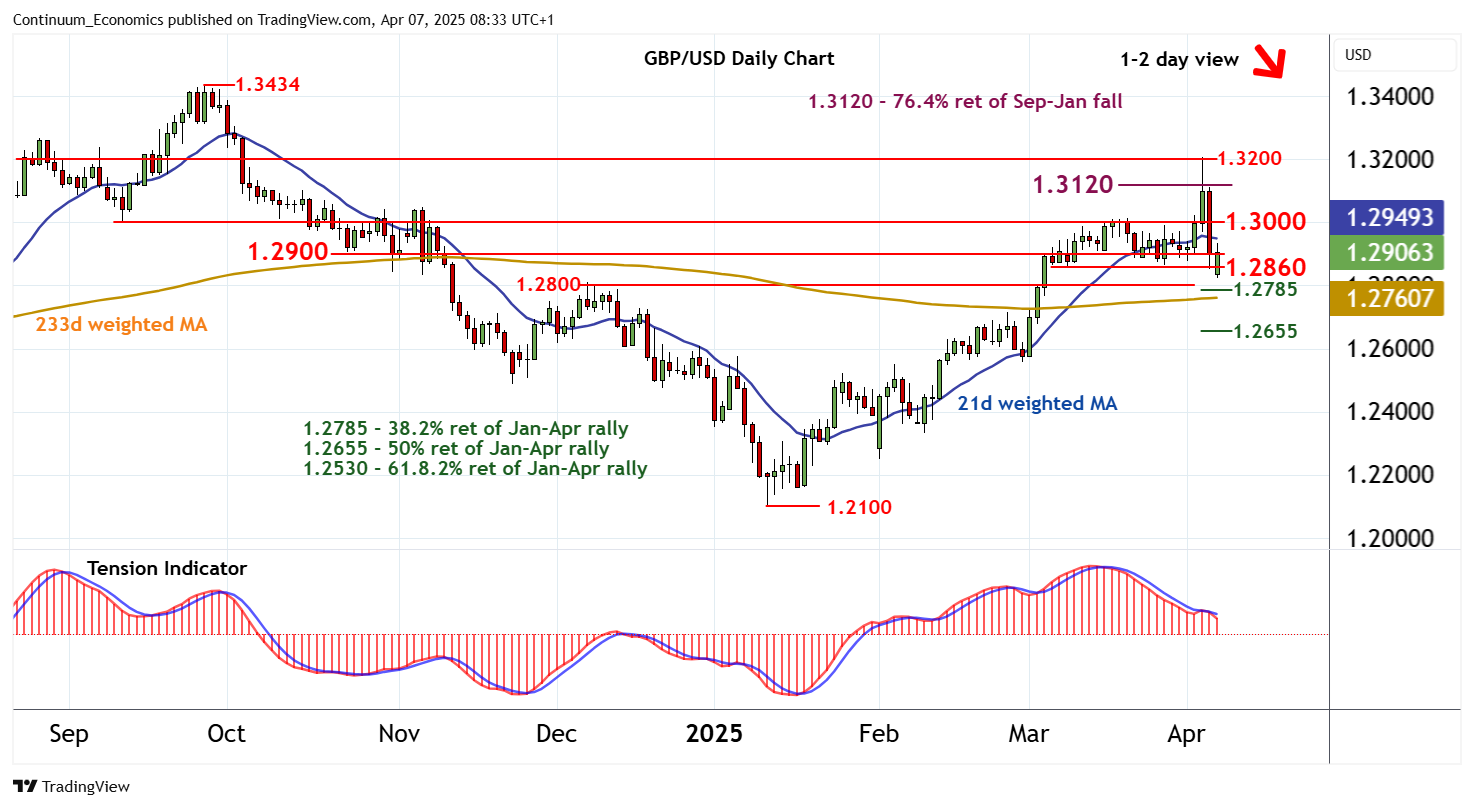
| R3 | 1.3200 | * | break level | S2 | 1.2860 | * | 6-10 Mar lows | |
| R2 | 1.3100/20 | * | cong; 76.4% ret of Sep-Jan fall | S3 | 1.2800 | ** | congestion | |
| R1 | 1.3000 | ** | range highs | S4 | 1.2785 | ** | 38.2% ret of Jan-Apr rally |
Asterisk denotes strength of level
08:10 BST - The early break below support at the 1.2860 lows from 6-10 March has bounced from 1.2825~, as oversold intraday studies flatten, with prices currently balanced in choppy trade just above congestion support at 1.2900. Daily stochastics and the daily Tension Indicator have turned down once again, and weekly charts are also coming under fresh pressure, highlighting a deterioration in sentiment and room for further losses in the coming sessions. A break back below 1.2900 will open up 1.2860, with a further close beneath here turning sentiment outright negative and extend April losses towards the 1.2785 Fibonacci retracement and congestion around 1.2800. Meanwhile, resistance is lowered to 1.3000 and should cap any immediate tests higher.