Published: 2026-05-07T06:45:04.000Z
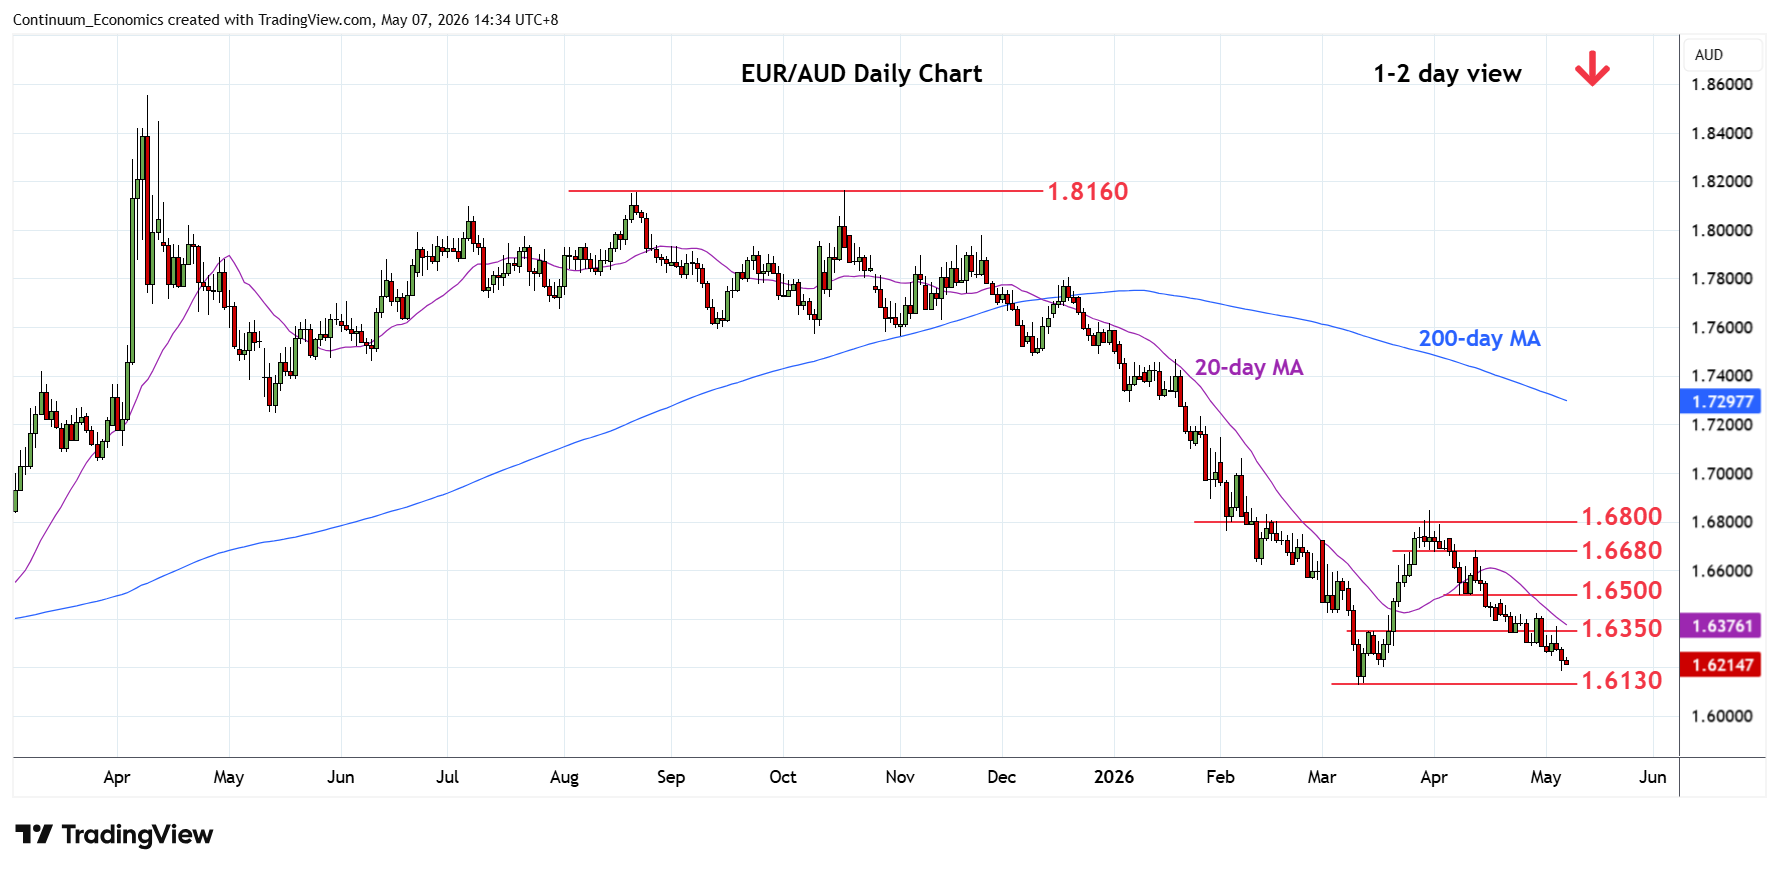
Chart EUR/AUD Update: Still heavy, 1.6130 low at risk
-
Consolidating test of the 1.6200 level but pressure remains on the downside and see scope for break to expose 1.6130 March YTD low to retest
| Levels | Imp | Comment | Levels | Imp | Comment | |||
|---|---|---|---|---|---|---|---|---|
| R4 | 1.6600/20 | * | congestion | S1 | 1.6200 | * | 18 Mar low | |
| R3 | 1.6500 | ** | congestion, 8 Apr low | S2 | 1.6130 | ** | 11 Mar YTD low | |
| R2 | 1.6400/25 | * | congestion, 5 Mar low | S3 | 1.6000 | ** | figure, congestion | |
| R1 | 1.6350 | * | congestion, 13 Mar high | S4 | 1.5960 | ** | 2024 year low |
Asterisk denotes strength of level
06:40 GMT - Consolidating test of the 1.6200 level but pressure remains on the downside and see scope for break to expose 1.6130 March YTD low to retest. Reaction here can be expected but negative daily studies suggest this giving way to break later to further retrace the 2022/2025 rally. Lower will see room for extension to target the 1.6000 figure. Lower still, will see room to 1.5960 the 2024 year low and 1.5915, 61.8% Fibonacci retracement. Meanwhile, resistance remains at the 1.6350 congestion and this extend to the 1.6400/25 area.