Chart USD/CAD Update: Leaning lower
Anticipated losses have tested below congestion support at 1.3850
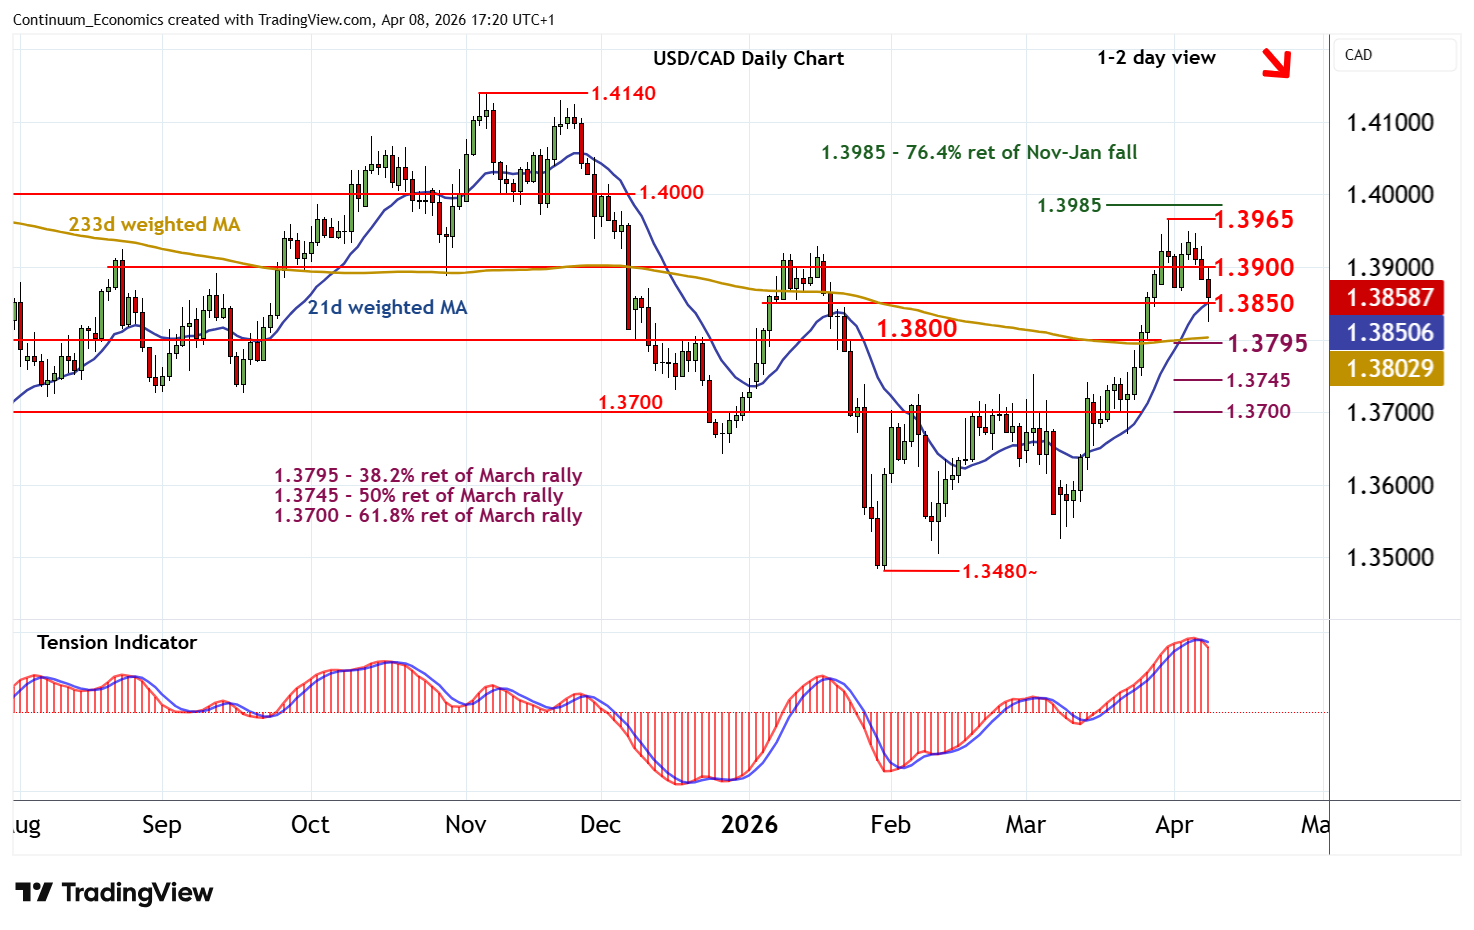
| Levels | Imp | Comment | Levels | Imp | Comment | |||
|---|---|---|---|---|---|---|---|---|
| R4 | 1.4000 | ** | congestion | S1 | 1.3850 | * | congestion | |
| R3 | 1.3985 | ** | 76.4% ret of Nov-Jan fall | S2 | 1.3795/00 | * | 38.2% ret; congestion | |
| R2 | 1.3965 | * | 31 Mar YTD high | S3 | 1.3745 | ** | 50% ret of March rally | |
| R1 | 1.3900 | * | congestion | S4 | 1.3700 | ** | cong, 61.8% ret |
Asterisk denotes strength of level
17:00 BST - Anticipated losses have tested below congestion support at 1.3850, with prices reaching 1.3825~ before bouncing back above 1.3850. Daily readings are falling, highlighting room for a retest below 1.3850. But rising weekly charts could limit initial scope in renewed consolidation above strong support at the 1.3795 Fibonacci retracement and congestion around 1.3800. A close beneath here, however, will add weight to sentiment and open up the 1.3745 retracement. Meanwhile, resistance is lowered to congestion around 1.3900. A close back above here, if seen, would help to stabilise sentiment and prompt consolidation beneath strong resistance at the 1.3965 current year high of 31 March.