Chart USD/ZAR Update: Consolidating
Little change, as prices consolidate around 17.6000, following the retest of congestion resistance within 17.7000-17.8000
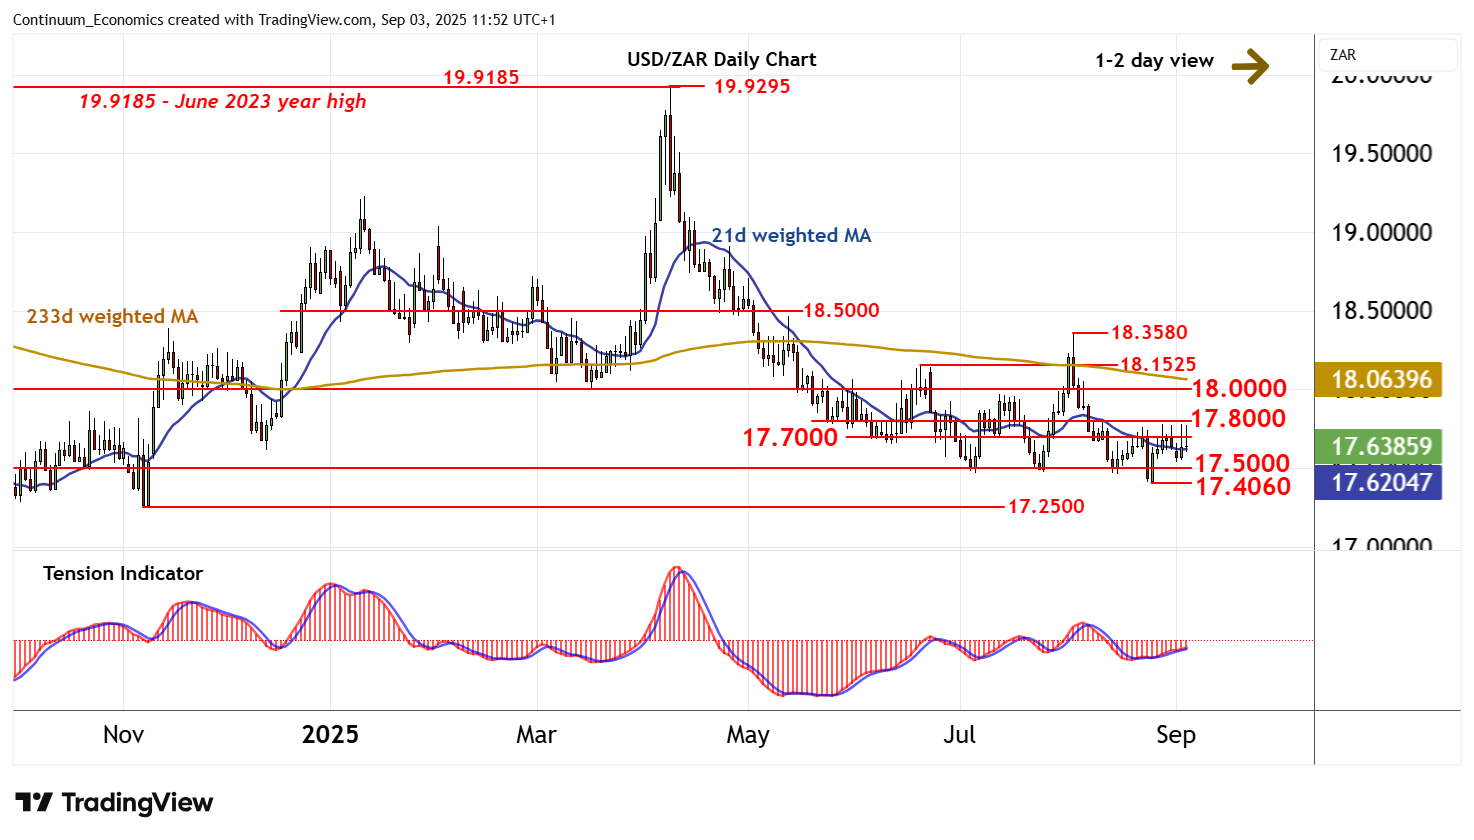
| Level | Comment | Level | Comment | |||||
|---|---|---|---|---|---|---|---|---|
| R4 | 18.1525 | ** | 19 Jun (m) high | S1 | 17.5000 | ** | congestion | |
| R3 | 18.0000 | ** | congestion | S2 | 17.4060 | ** | 25 Aug YTD low | |
| R2 | 17.8000 | * | congestion | S3 | 17.2500 | ** | 7 Nov (m) low | |
| R1 | 17.7000 | * | congestion | S4 | 17.0315 | ** | 30 Sep 2024 (y) low |
Asterisk denotes strength of level
11:25 BST - Little change, as prices consolidate around 17.6000, following the retest of congestion resistance within 17.7000-17.8000. Both daily and weekly readings are mixed, highlighting a cautious tone and room for further consolidation into the coming sessions. However, longer-term charts are under pressure, pointing to potential for a later break lower. Support remains at congestion around 17.5000 and extends to the 17.4060 current year low of 25 August. A break beneath here would turn sentiment negative and extend April losses towards the 17.0315 year low of 30 September 2024. Meanwhile, a break above 17.8000, if seen, would improve sentiment and put focus on further congestion around 18.0000, where fresh selling interest is expected to appear.