Chart USD/RUB Update: Consolidating sharp losses - studies under pressure
Sharp losses from the 86.8900 current year high of 19 March have found support at 80.3440
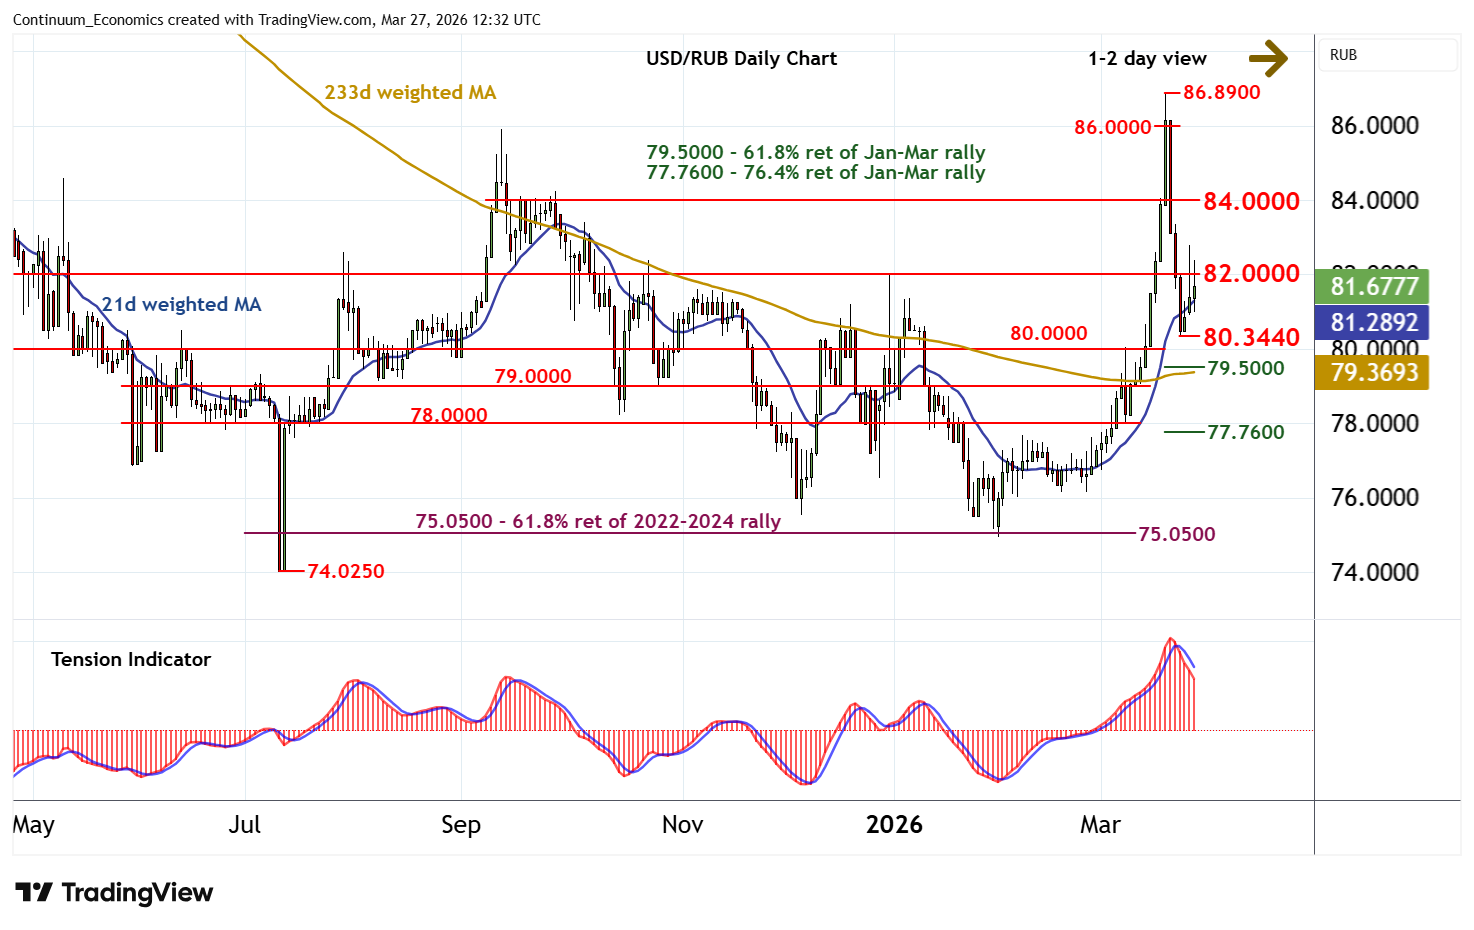
| Levels | Comment | Levels | Comment | |||||
| R4 | 86.8900 | ** | 19 Mar YTD high | S1 | 80.3440 | * | 24 Mar low | |
| R3 | 86.0000 | * | congestion | S2 | 80.0000 | * | break level | |
| R2 | 84.0000 | * | congestion | S3 | 79.5000 | ** | 61.8% ret of Jan-Mar rally | |
| R1 | 82.0000 | ** | congestion | S4 | 79.0000 | * | break level |
Asterisk denotes strength of level
12:10 GMT - Sharp losses from the 86.8900 current year high of 19 March have found support at 80.3440, with choppy price action posting a test above congestion resistance at 82.0000 before settling into consolidation beneath here. Oversold daily stochastics are unwinding, suggesting room for further cautious trade in the coming sessions, before the bearish daily Tension Indicator prompts fresh tests lower. A break below 80.3440 will add weight to sentiment and extend losses below 80.0000 towards the 79.5000 Fibonacci retracement. But mixed weekly charts and improving longer-term readings should limit any immediate tests in short-covering/consolidation. Meanwhile, a close above 82.0000 would help to stabilise sentiment and prompt consolidation beneath further congestion around 84.0000.