Published: 2026-03-02T08:21:19.000Z
Chart EUR/AUD Update: Consolidating losses
1
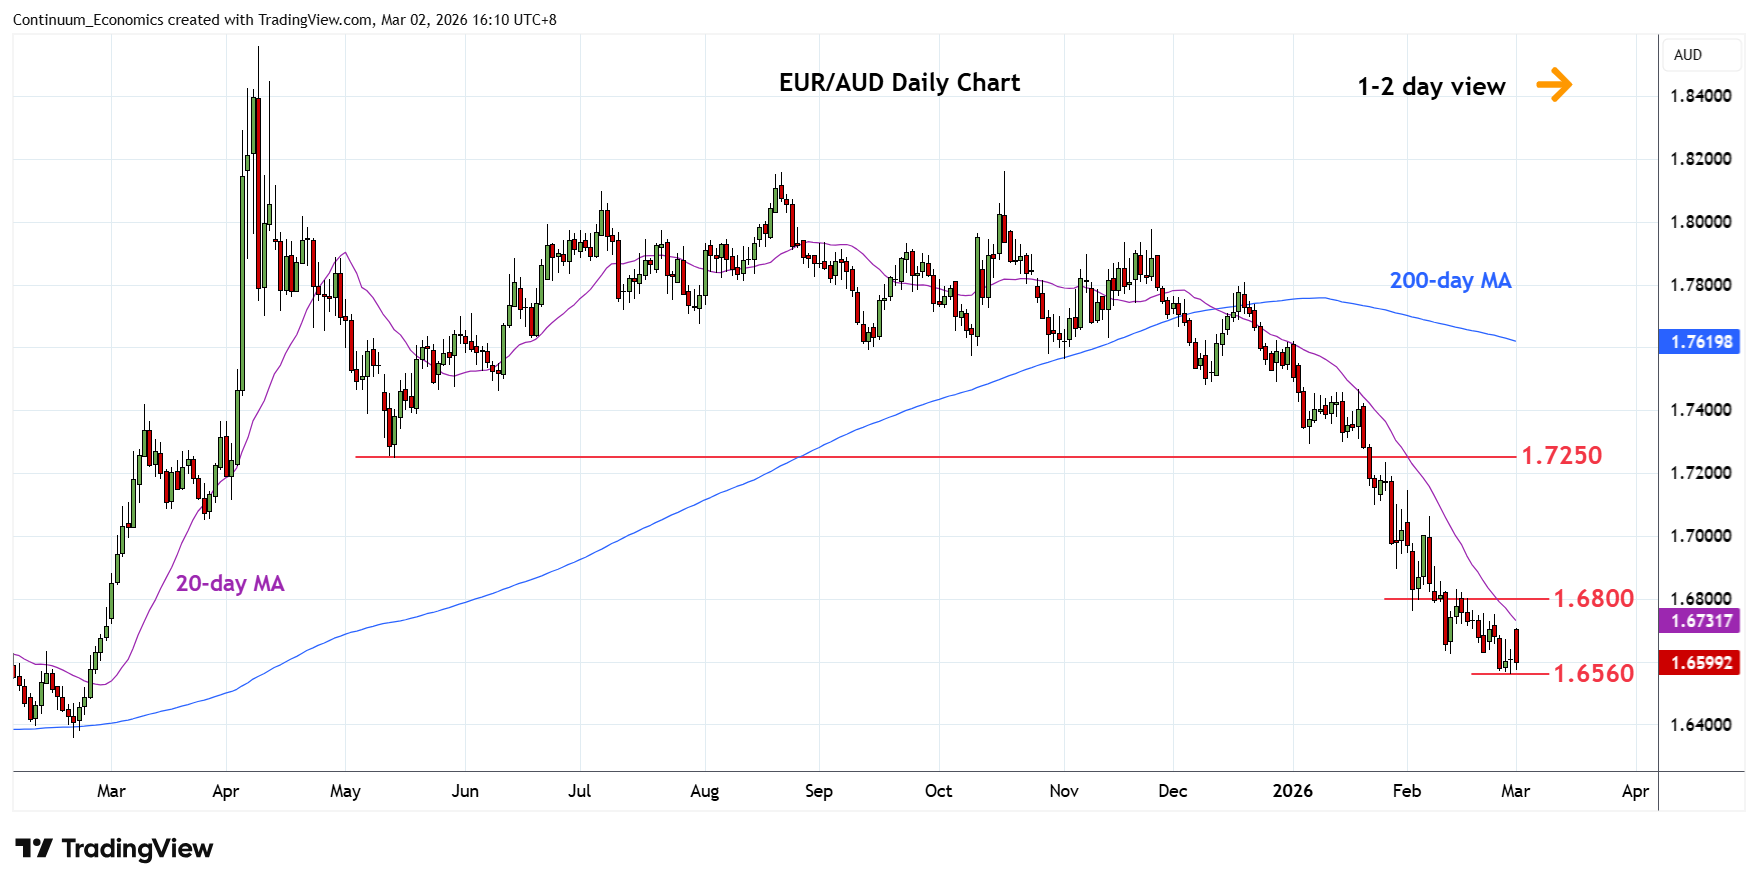
Turned up from the 1.6560 low as prices consolidate sharp losses from the 1.7620, January high
| Levels | Imp | Comment | Levels | Imp | Comment | |||
|---|---|---|---|---|---|---|---|---|
| R4 | 1.7000 | * | figure, congestion | S1 | 1.6560 | ** | 27 Feb YTD low | |
| R3 | 1.6900 | * | congestion | S2 | 1.6500 | * | congestion | |
| R2 | 1.6800 | * | congestion | S3 | 1.6420 | * | 50% 2022/2025 rally | |
| R1 | 1.6700/50 | * | congestion | S4 | 1.6355 | ** | 20 Feb 2025 year low |
Asterisk denotes strength of level
08:15 GMT - Turned up from the 1.6560 low as prices consolidate sharp losses from the 1.7620, January high. Bounce see prices unwinding the oversold daily studies to reach resistance at the 1.6700/50 area. Break here will open up room for stronger gains to resistance at the 1.6800/1.6900 congestion. Corrective gains are expected to give way to renewed selling pressure later. Meanwhile, support at the 1.6560 low should now underpin. A later break will see extension to the 1.6500 congestion and 1.6420, 50% Fibonacci retracement.