Published: 2025-12-09T00:35:30.000Z
Chart NZD/USD Update: Consolidating test of .5785, Fibonacc level
-
Strong gains from the .5578 November low has seen gains to .5785, 38.2% Fibonacci level
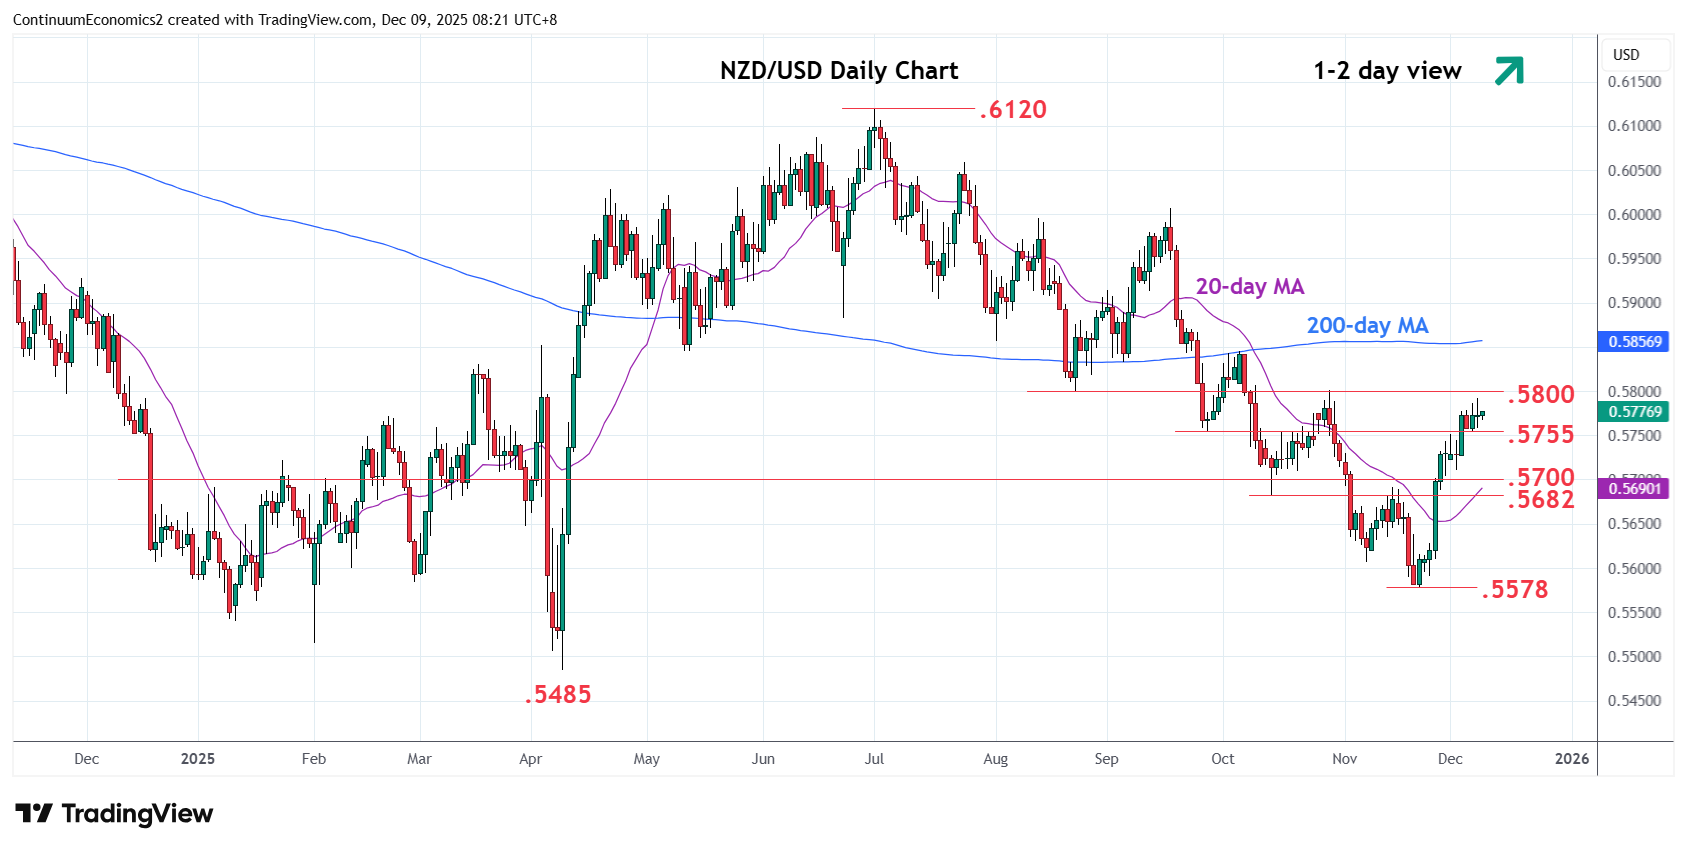
| Levels | Imp | Comment | Levels | Imp | Comment | |||
|---|---|---|---|---|---|---|---|---|
| R4 | .5900/10 | * | congestion, 61.8% | S1 | .5755/50 | * | Aug low, congestion | |
| R3 | .5850/55 | ** | 50%, 1 Aug low | S2 | .5700/.5682 | ** | congestion, Oct low | |
| R2 | .5800 | ** | 22 Aug low | S3 | .5650 | * | congestion | |
| R1 | .5785 | * | 38.2% Jul/Nov fall | S4 | .5606 | * | 7 Nov low |
Asterisk denotes strength of level
00:30 GMT - Strong gains from the .5578 November low has seen gains to .5785, 38.2% Fibonacci level. Pause here see prices unwinding overbought intraday and daily studies but consolidation here and the .5800 level expected to give way to renewed buying interest. Clearance here will further retrace the July/November losses and see room for extension to strong resistance at the .5850/.5855 area. Meanwhile, support is raised to the .5755/50, August low and congestion area. Below here will delay bulls and see room for deeper pullback to strong support at the .5700/.5682 area.