Published: 2026-02-10T17:19:26.000Z
Chart USD/CAD Update: Poised for further losses
4
Price action remains under pressure
| Levels | Imp | Comment | Levels | Imp | Comment | |||
|---|---|---|---|---|---|---|---|---|
| R4 | 1.3850 | congestion | S1 | 1.3540 | ** | 16 June 2025 (y) low | ||
| R3 | 1.3800 | ** | congestion | S2 | 1.3500 | ** | congestion | |
| R2 | 1.3700 | * | congestion | S3 | 1.3480~ | ** | 30 Jan YTD low | |
| R1 | 1.3600 | * | congestion | S4 | 1.3420 | ** | September 2024 low |
Asterisk denotes strength of level
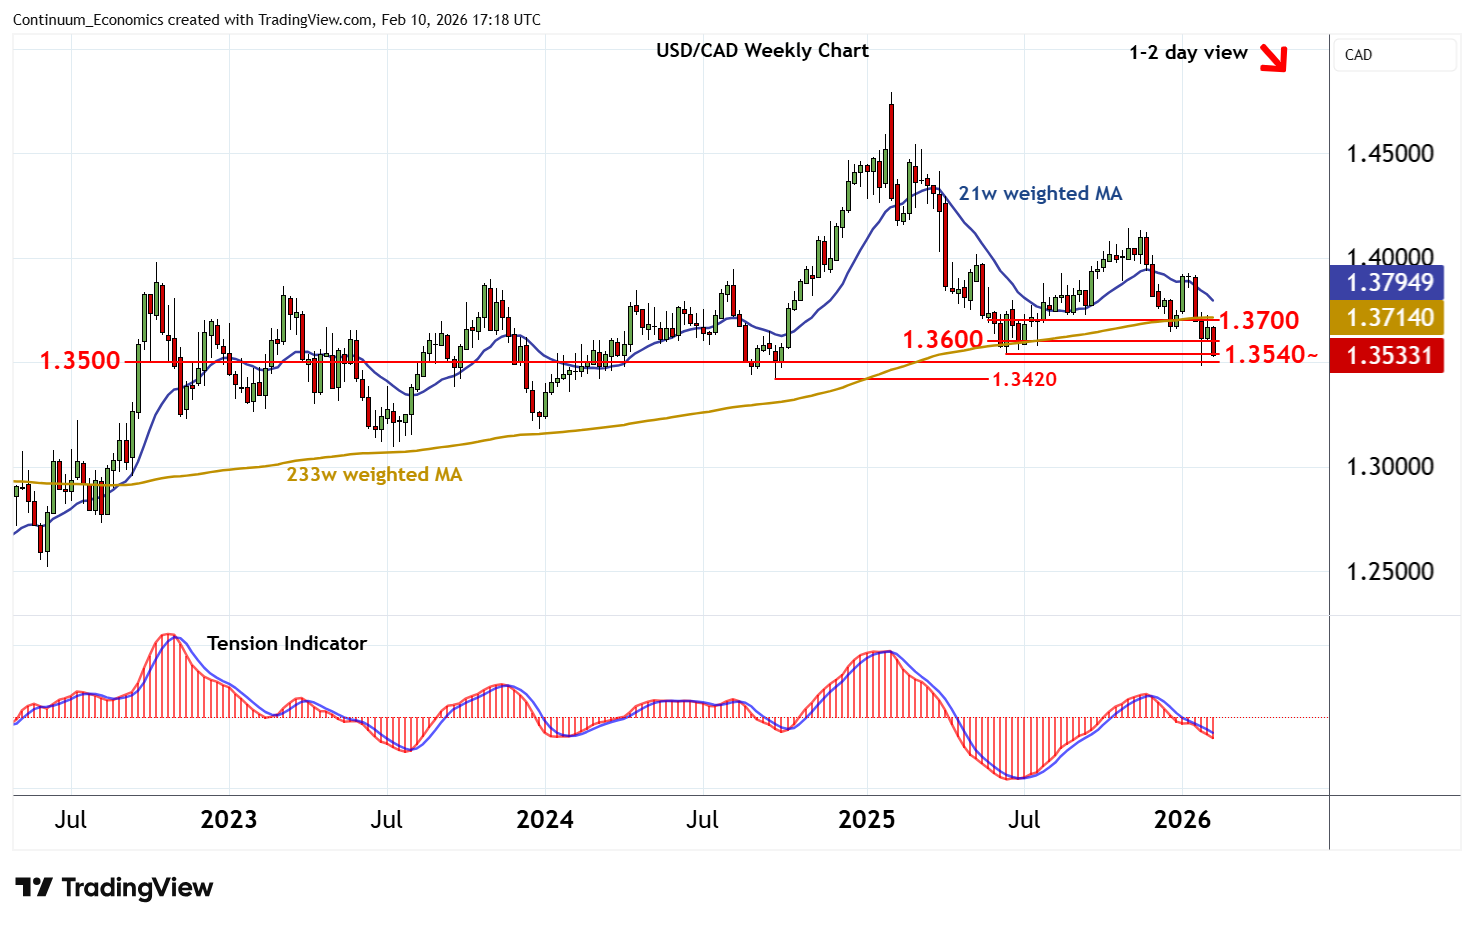
17:00 GMT - Price action remains under pressure, as daily studies turn down, with trade currently balanced around the 1.3540 year low of 16 June 2025. Daily studies are deteriorating and broader weekly charts are negative, highlighting room for a break towards congestion support at 1.3500. A further close beneath here will add weight to sentiment and extend February 2025 losses below the 1.3480~ current year low of 30 January towards the 1.3420 low of September 2024. Meanwhile, resistance remains at congestion around 1.3600. A close above here, if seen, will help to stabilise price action and prompt consolidation beneath 1.3700.