Published: 2026-04-30T15:52:17.000Z
Chart USD/CAD Update: Under pressure in both USD- and CAD-driven trade
2
Cautious trade has given way to a pullback in both USD- and CAD-driven trade
| Levels | Imp | Comment | Levels | Imp | Comment | |||
|---|---|---|---|---|---|---|---|---|
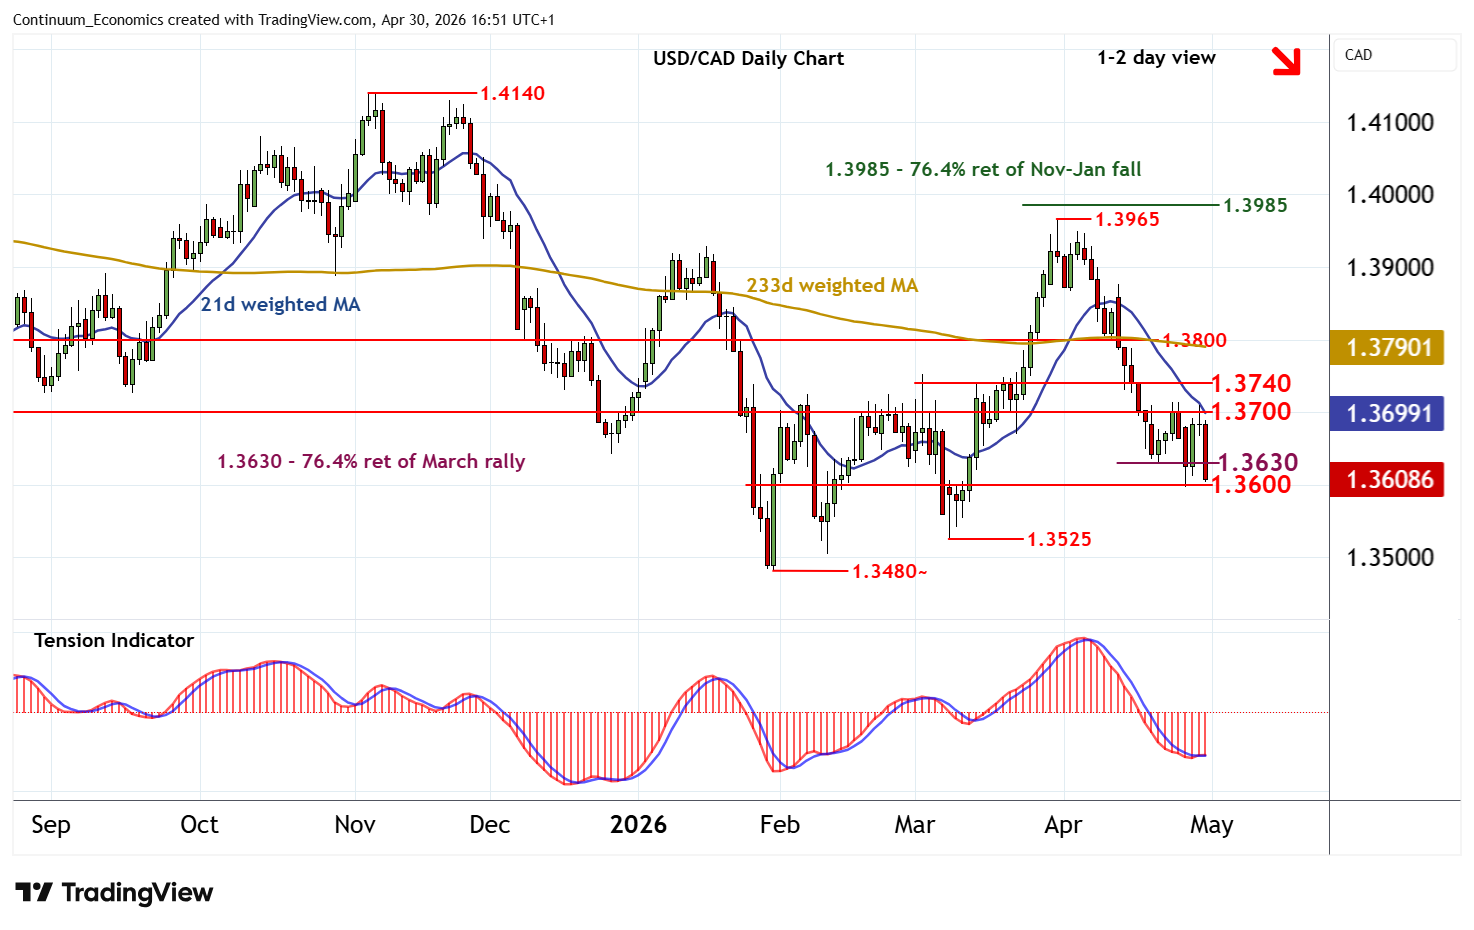
| R4 | 1.3850 | * | congestion | S1 | 1.3630 | ** | 76.4% ret of March rally | |
| R3 | 1.3800 | * | congestion | S2 | 1.3600 | ** | congestion | |
| R2 | 1.3740 | * | break level | S3 | 1.3525 | * | 9 Mar (m) low | |
| R1 | 1.3700 | ** | congestion | S4 | 1.3480~ | ** | 30 Jan YTD low |
Asterisk denotes strength of level
16:35 BST - Cautious trade has given way to a pullback in both USD- and CAD-driven trade, with prices currently pressuring support within congestion around 1.3600 and the 1.3630 Fibonacci retracement. Mixed daily readings highlight potential for consolidation within here. But broader weekly charts continue to fall, pointing to room for a later break and extension of late-March losses towards the 1.3525 monthly low of 9 March. Meanwhile, resistance remains up to congestion around 1.3700 and should cap any immediate tests higher.