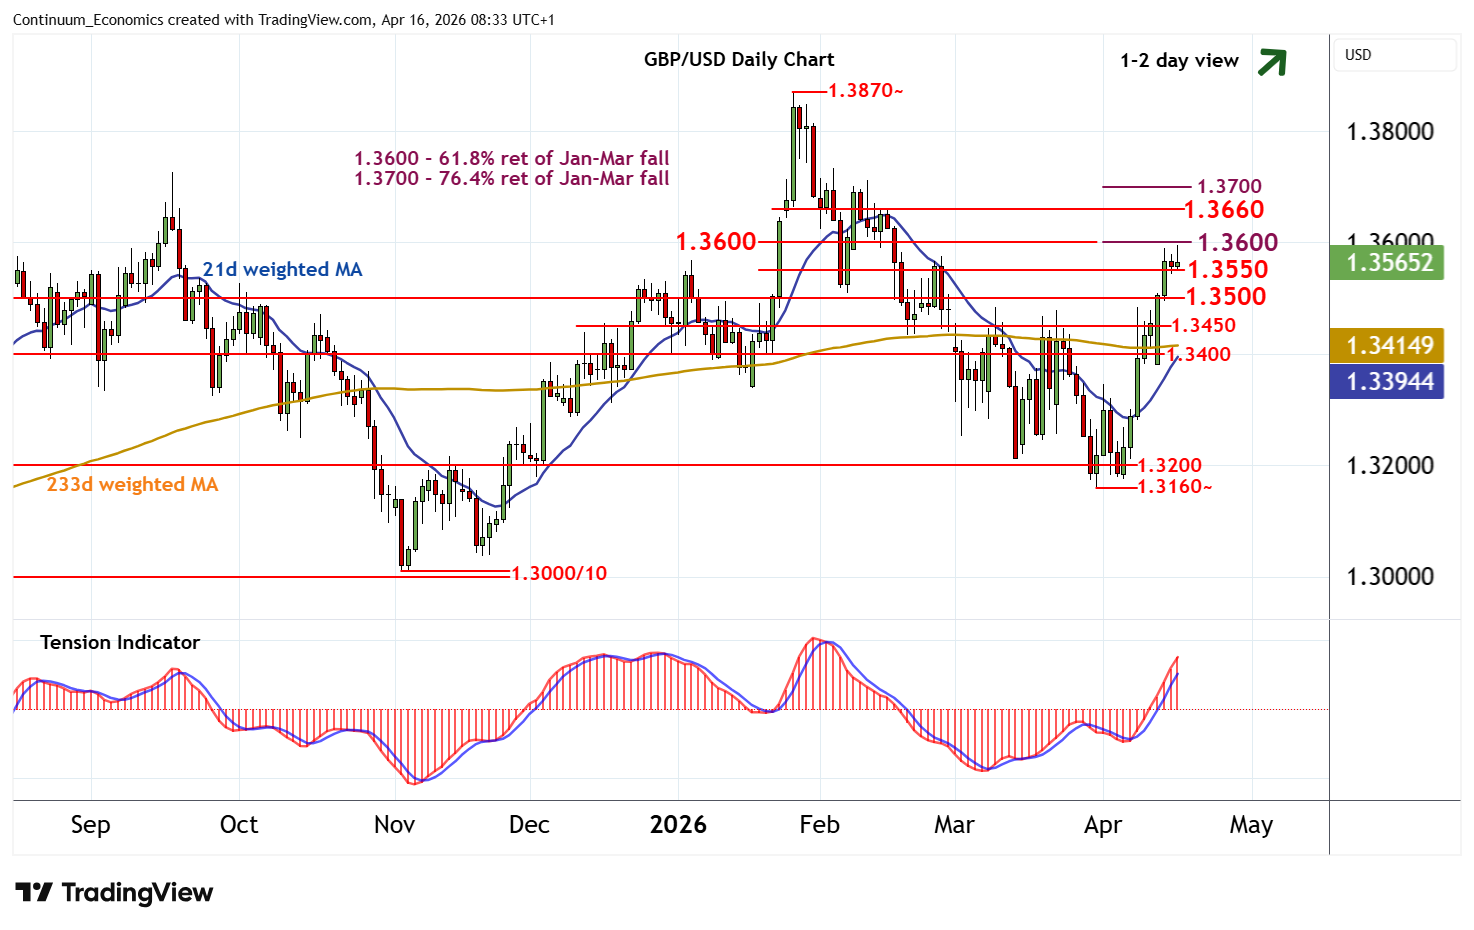
Chart GBP/USD Update: Balanced beneath strong resistance at 1.3600
The break above 1.3550 has given way to anticipated consolidation beneath strong resistance at 1.3600
| Level | Comment | Level | Comment | |||||
|---|---|---|---|---|---|---|---|---|
| R4 | 1.3733 | * | 4 Feb (m) high | S1 | 1.3550 | * | congestion | |
| R3 | 1.3700 | ** | 76.4% ret of Jan-Mar fall | S2 | 1.3500 | ** | congestion | |
| R2 | 1.3660 | * | congestion | S3 | 1.3450 | break level | ||
| R1 | 1.3600 | ** | congestion; 61.8% ret | S4 | 1.3400 | ** | congestion |
Asterisk denotes strength of level
08:10 BST - The break above 1.3550 has given way to anticipated consolidation beneath strong resistance at 1.3600, as daily stochastics remain flat within overbought areas, with prices currently trading around 1.3570. The daily Tension Indicator continues to rise and broader weekly charts are also improving, highlighting room for further strength in the coming sessions. A close above 1.3600 will improve price action and extend late-March gains towards congestion around 1.3660. Stronger resistance at the 1.3700 should prompt more significant profit-taking. Meanwhile, support is raised to congestiona round 1.3550. A close beneath here, if seen, will stabilise price action and give way to consolidation above further congestion around 1.3550.