Published: 2026-04-21T12:21:42.000Z
Chart USD/ZAR Update: Consolidating
1
Little change, as prices extend cautious trade beneath 16.4000
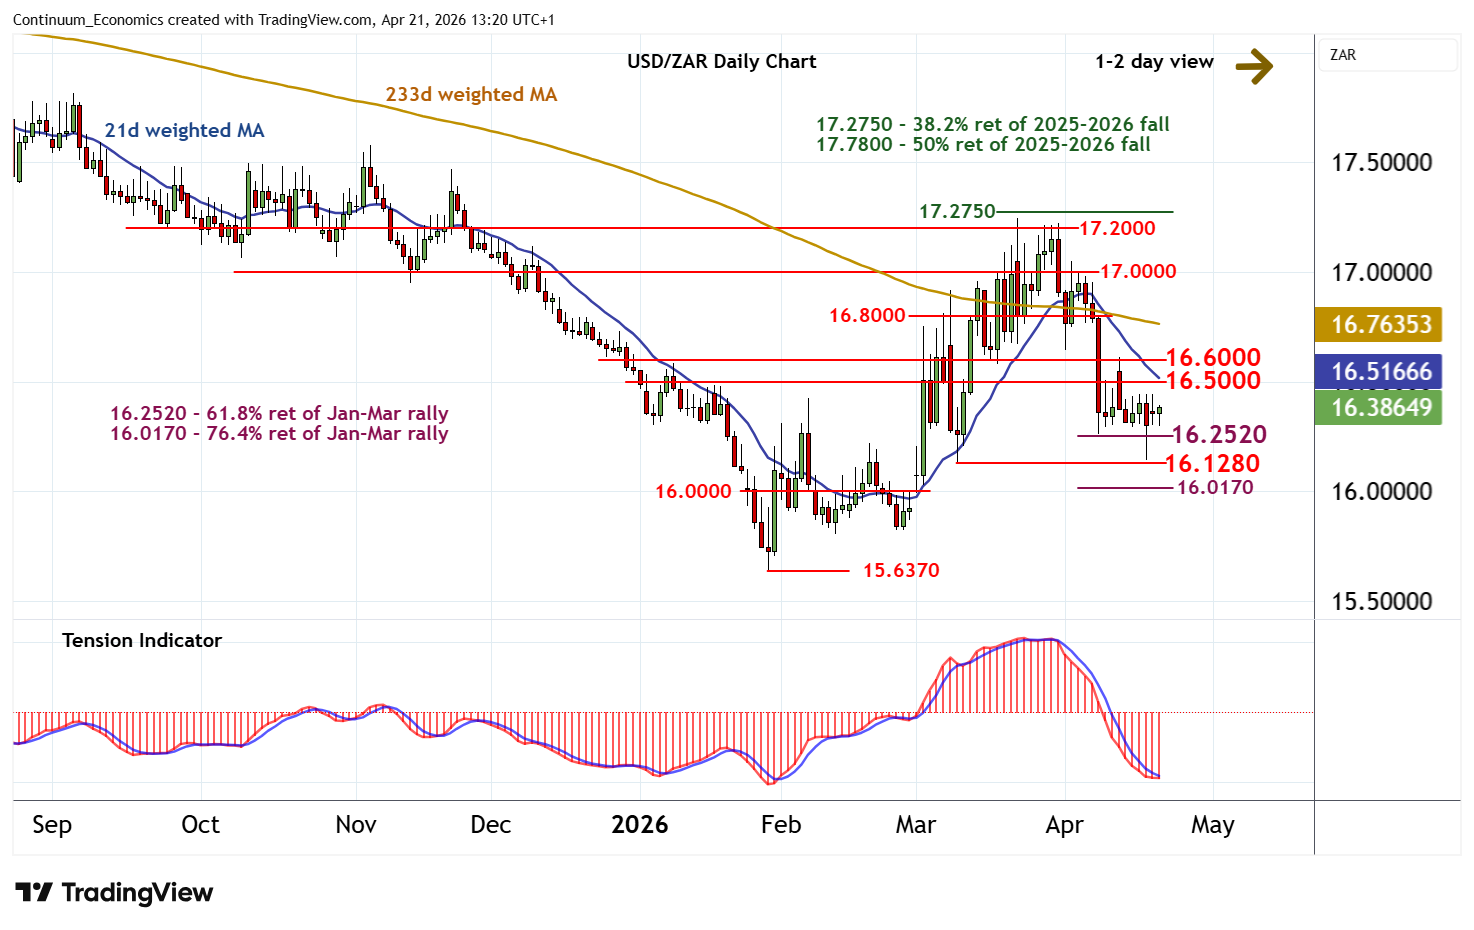
| Level | Comment | Level | Comment | |||||
|---|---|---|---|---|---|---|---|---|
| R4 | 17.0000 | * | congestion | S1 | 16.2520 | ** | 61.8% ret of Jan-Mar rally | |
| R3 | 16.8000 | * | congestion | S2 | 16.1280 | * | 10 Mar (w) low | |
| R2 | 16.6000 | break level | S3 | 16.0170 | ** | 76.4% ret of Jan-Mar rally | ||
| R1 | 16.5000 | break level | S4 | 16.0000 | ** | congestion |
Asterisk denotes strength of level
13:15 BST - Little change, as prices extend cautious trade beneath 16.4000. Oversold daily stochastics are edging higher and the bearish daily Tension Indicator is flattening, suggesting room for a test above here. But negative weekly charts should prompt renewed selling interest towards resistance within the 16.5000 - 16.6000 range. Following cautious trade, fresh losses are looked for. However, a close below support at the 16.2520 Fibonacci retracement is needed to turn sentiment negative and extend late-March losses back to 16.1280, ahead of the 16.0170 retracement.