Chart USD/CHF Update: Limited tests higher

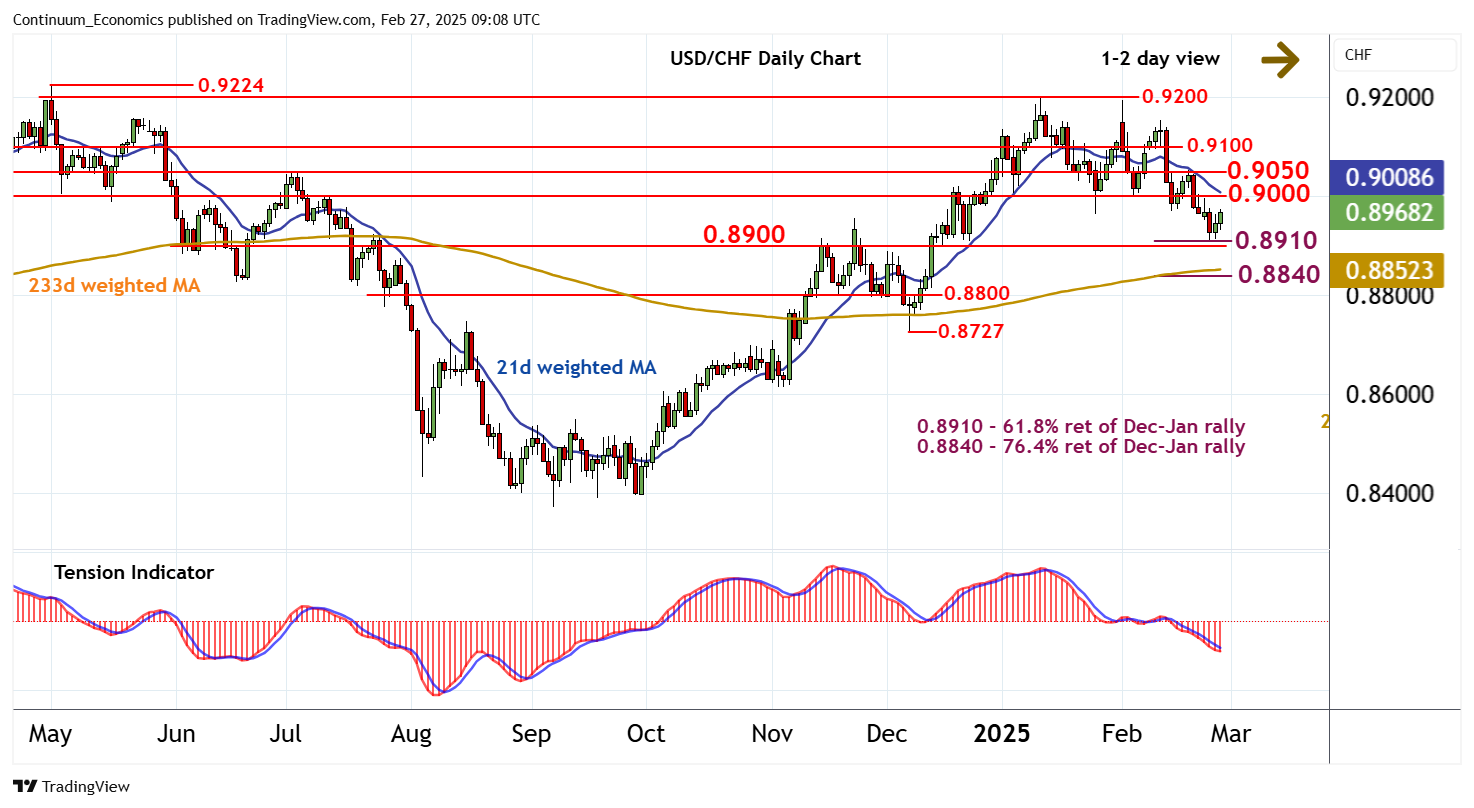
The test of support at the 0.8900 break level and the 0.8910 Fibonacci retracement is giving way to a bounce
| Level | Comment | Level | Comment | |||||
|---|---|---|---|---|---|---|---|---|
| R4 | 0.9150 | * | congestion tops | S1 | 0.8900/10 | ** | break level; 61.8% ret | |
| R3 | 0.9100 | ** | break level | S2 | 0.8840 | ** | 76.4% ret of Dec-Jan rally | |
| R2 | 0.9050 | * | congestion | S3 | 0.8800 | ** | congestion | |
| R1 | 0.9000 | ** | congestion | S4 | 0.8727 | ** | 6 Dec (m) low |
Asterisk denotes strength of level
08:55 GMT - The test of support at the 0.8900 break level and the 0.8910 Fibonacci retracement is giving way to a bounce, as intraday studies rise and oversold daily stochastics flatten, with prices currently trading around 0.8965. A test of congestion resistance at 0.9000 cannot be ruled out. But the bearish daily Tension Indicator and negative weekly charts are expected to limit any extension beyond here in renewed selling interest towards 0.9050. Following corrective trade, fresh losses are looked for. However, a close below 0.8900/10 is needed to turn sentiment negative and extend January losses towards the 0.8840 retracement.