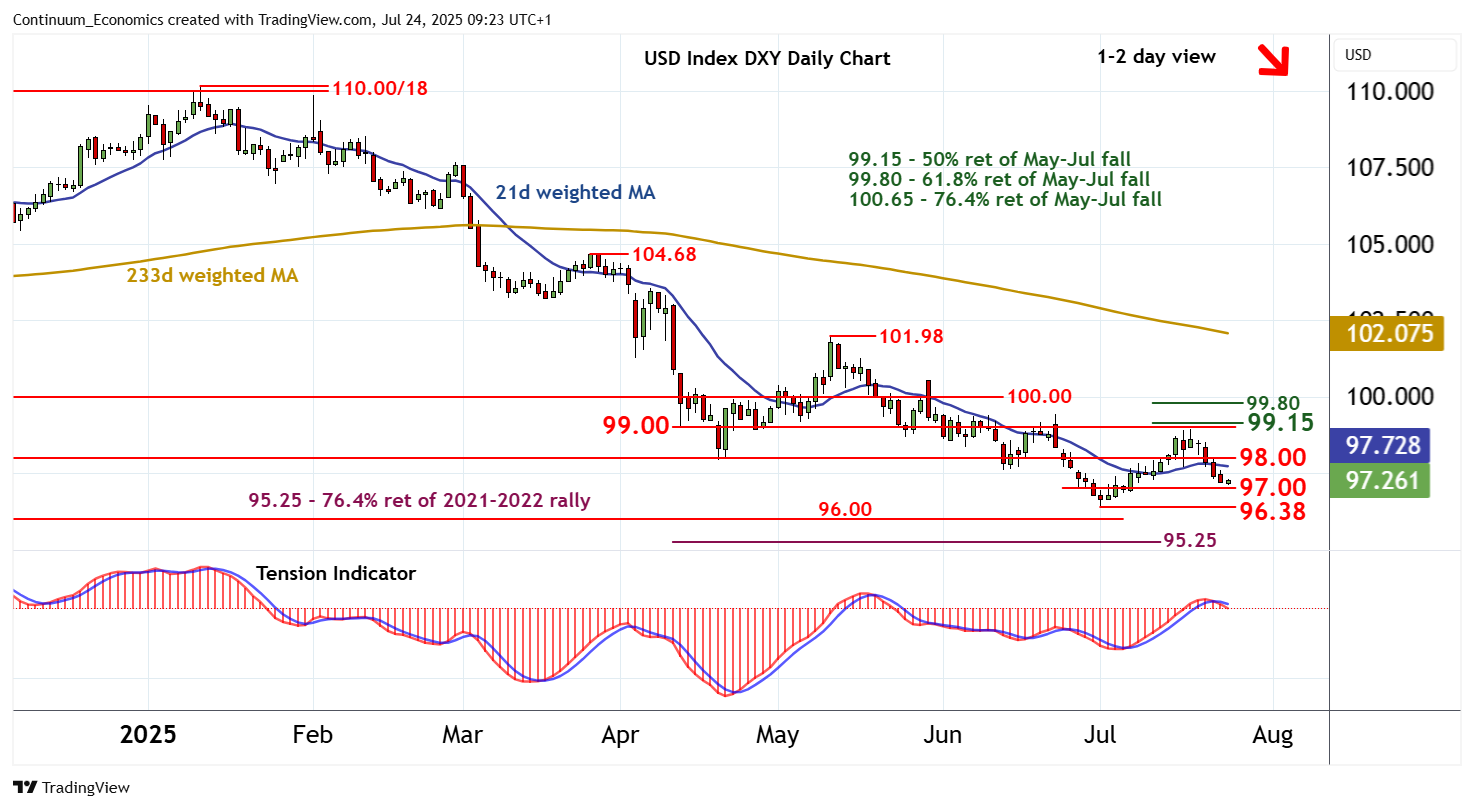
Chart USD Index DXY Update: Under pressure

Anticipated losses have met buying interest above congestion support at 97.00
| Levels | Imp | Comment | Levels | Imp | Comment | |||
|---|---|---|---|---|---|---|---|---|
| R4 | 99.15 | ** | 50% ret of May-Jul fall | S1 | 97.00 | * | congestion | |
| R3 | 99.00 | break level | S2 | 96.50 | * | congestion | ||
| R2 | 98.95 | * | 17 Jul (w) high | S3 | 96.38 | * | 1 Jul YTD low | |
| R1 | 98.00 | * | congestion | S4 | 96.00 | * | congestion |
Asterisk denotes strength of level
09:05 BST - Anticipated losses have met buying interest above congestion support at 97.00, as oversold intraday studies unwind, with prices currently balanced around 97.25. Daily stochastics continue to track lower and the daily Tension Indicator is also falling, highlighting room for further losses in the coming sessions. A break below 97.00 cannot be ruled out. But rising weekly charts should limit any initial losses in fresh buying interest above critical support at the 96.38 current year low of 1 July. Meanwhile, a close back above congestion resistance at 98.00, if seen, would help to stabilise price action and prompt consolidation beneath 98.95/00.