Published: 2026-04-02T01:16:54.000Z
Chart EUR/JPY Update: Higher in consolidation
-
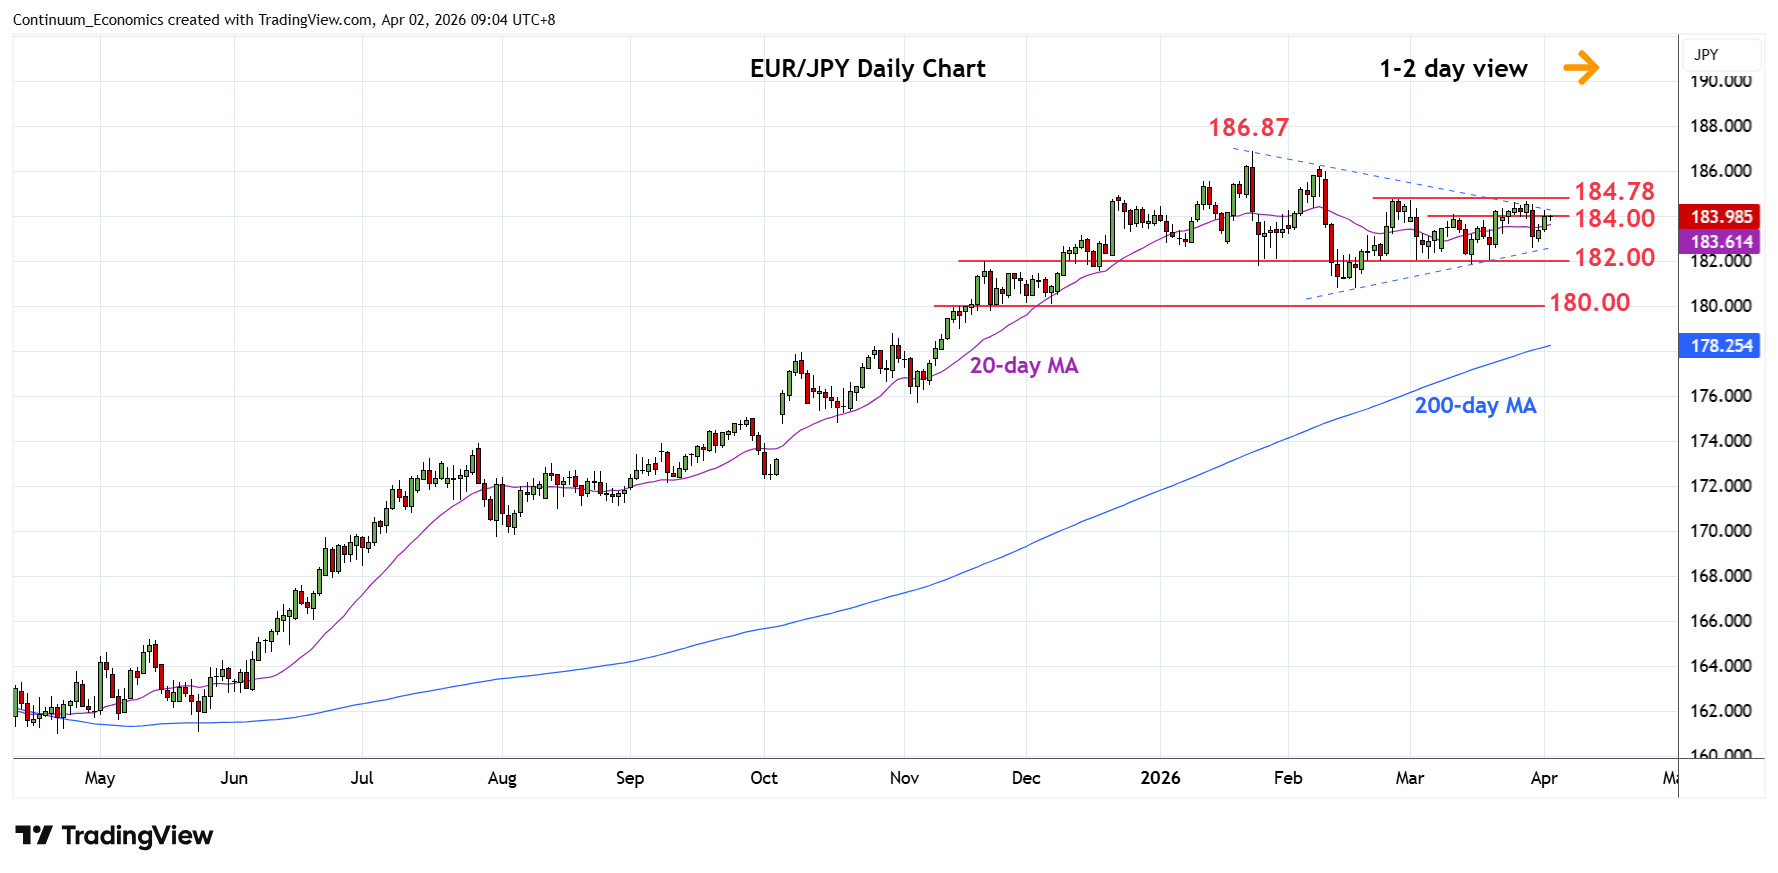
Higher in consolidation from the 182.60 low as prices extend choppy trade within the 182.00/184.78, 5-week range
| Levels | Imp | Comment | Levels | Imp | Comment | |||
|---|---|---|---|---|---|---|---|---|
| R4 | 186.87 | ** | 23 Jan YTD high | S1 | 182.60 | 30 Mar low | ||
| R3 | 186.00/22 | * | congestion, 9 Feb high | S2 | 182.00 | * | congestion | |
| R2 | 184.65/78 | ** | 27 Mar, 25 Feb highs | S3 | 180.80 | ** | 12 Feb YTD low | |
| R1 | 184.00 | * | congestion | S4 | 180.00 | ** | congestion |
Asterisk denotes strength of level
01:10 GMT - Higher in consolidation from the 182.60 low as prices extend choppy trade within the 182.00/184.78, 5-week range. Daily studies have turned mixed following pullback from the latter and suggest further ranging action below the 184.65/184.78 recent highs which is expected to cap. Lower will see room to retest the 182.00 support and where break will return focus to the 180.80, 12 February current year low. Below this will see room for deeper pullback to extend losses from the retrace the 186.87, January YTD high.