Published: 2025-07-11T11:26:29.000Z
Chart USD/ZAR Update: Back at resistance

Senior Technical Strategist
-
Choppy trade around 17.7000 has given way to a bounce back into resistance at 17.8000-17.8500
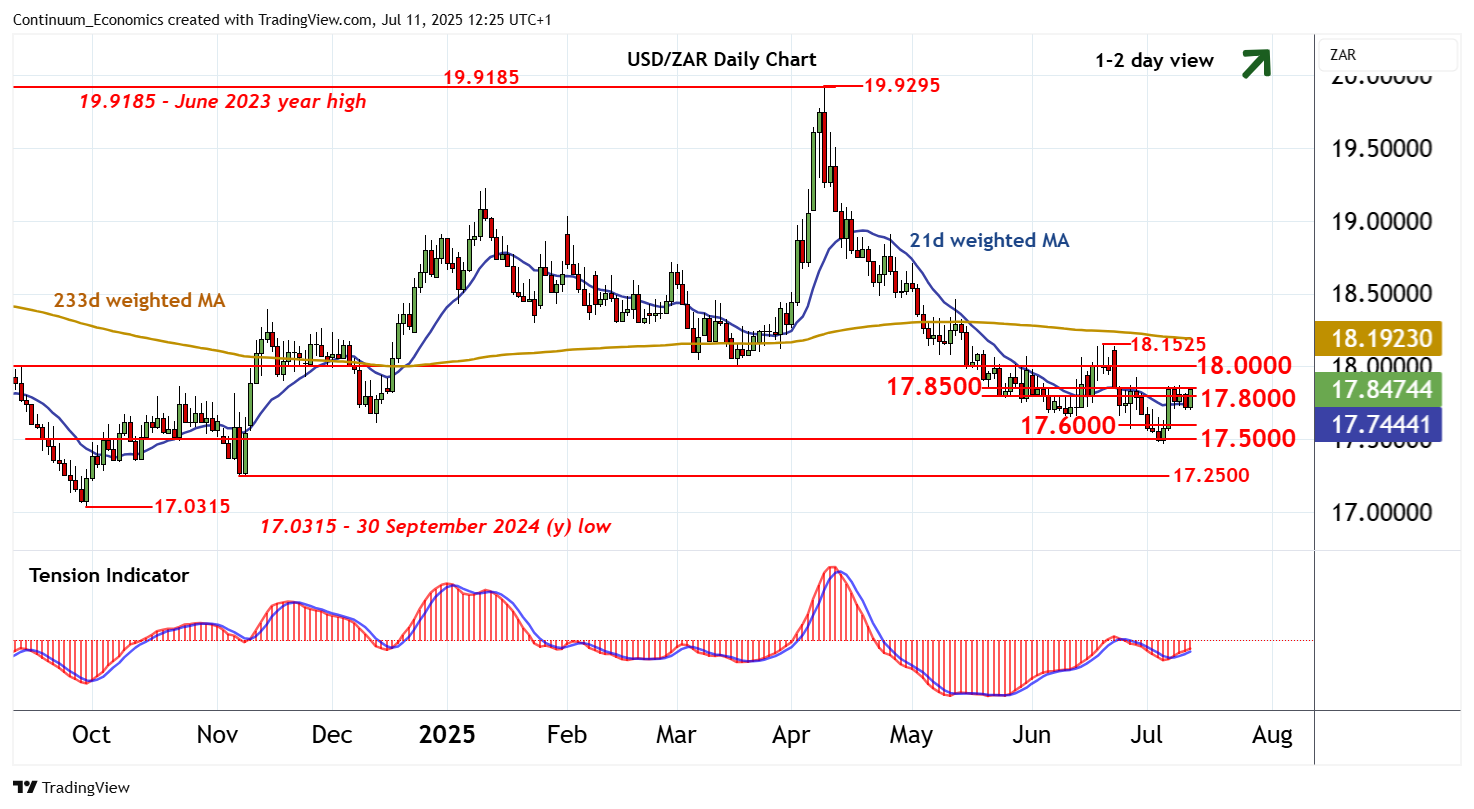
| Level | Comment | Level | Comment | |||||
|---|---|---|---|---|---|---|---|---|
| R4 | 18.1525 | ** | 19 Jun (m) high | S1 | 17.6000 | * | congestion | |
| R3 | 18.0000 | ** | congestion | S2 | 17.5000 | * | congestion | |
| R2 | 17.8500 | break level | S3 | 17.4680~ | current year low | |||
| R1 | 17.8000 | * | congestion | S4 | 17.2500 | * | 7 Nov (m) low |
Asterisk denotes strength of level
11:55 BST - Choppy trade around 17.7000 has given way to a bounce back into resistance at 17.8000-17.8500. Intraday studies are rising once again and daily readings have ticked up, suggesting potential for a break above here towards congestion resistance at 18.0000. Beyond here is critical resistance at the 18.1525 monthly high of 19 June. But mixed weekly charts are expected to limit any initial tests of this broad range in renewed consolidation. Meanwhile, support remains down to congestion around 17.6000 and should underpin any immediate setbacks.