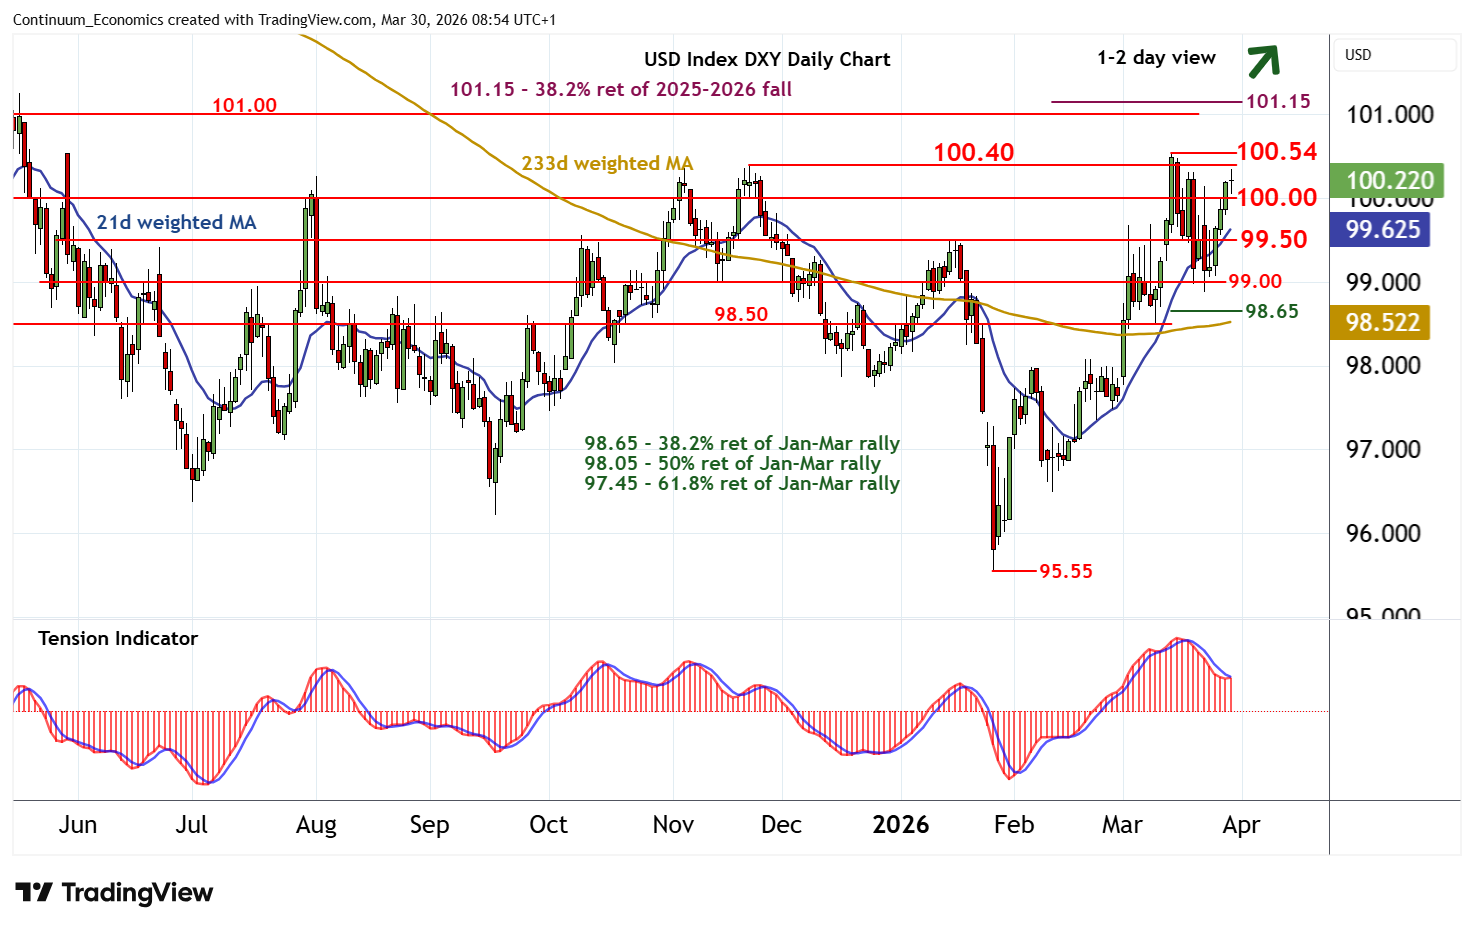
Chart USD Index DXY Update: Approaching strong resistance at 100.40/54
The anticipated break above 100.00 is giving way to consolidation beneath critical resistance at 100.40/54
| Levels | Imp | Comment | Levels | Imp | Comment | |||
|---|---|---|---|---|---|---|---|---|
| R4 | 102.00 | ** | break level, May 2025 high | S1 | 100.00 | ** | congestion | |
| R3 | 101.15 | ** | 38.2% ret of 2025-2026 fall | S2 | 99.50 | * | congestion | |
| R2 | 101.00 | * | congestion | S3 | 99.00 | ** | congestion | |
| R1 | 100.40/54 | ** | 21 Nov (m); 13 Mar YTD highs | S4 | 98.65 | * | 38.2% ret of Jan-Mar rally |
Asterisk denotes strength of level
08:45 BST - The anticipated break above 100.00 is giving way to consolidation beneath strong resistance at 100.40/54, as positive intraday studies flatten. Daily readings continue to improve, highlighting room for a later break above here and extension of late-January gains towards strong resistance at 101.00/15. But a tick lower in overbought weekly stochastics could limit any initial tests of this range in fresh consolidation, before the rising weekly Tension Indicator extends gains still further. Meanwhile, a close back below 100.00, if seen, would stabilise sentiment and prompt consolidation above congestion around 99.50.