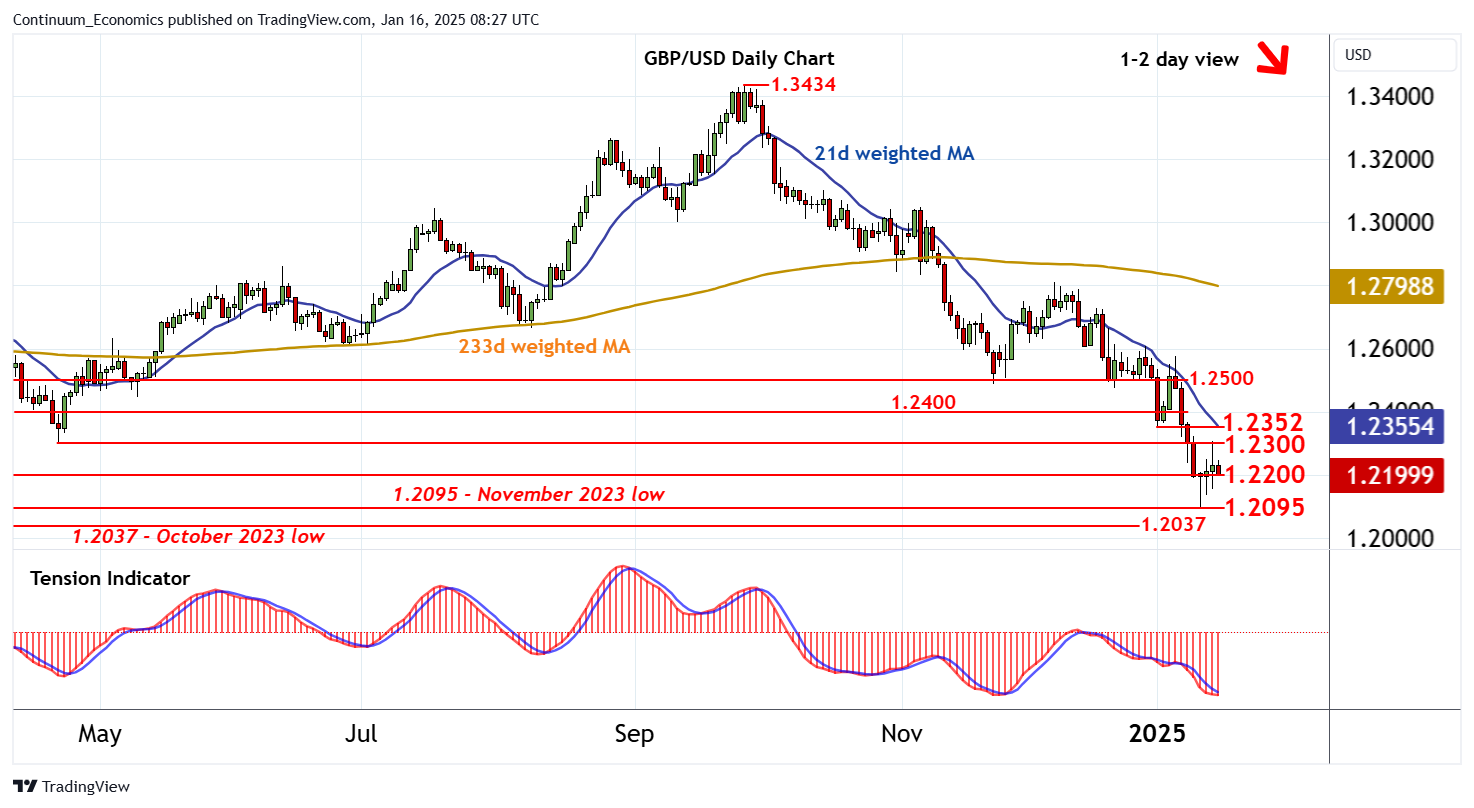
Chart GBP/USD Update: Prices remain under pressure

Choppy trade has met anticipated selling interest at the 1.2300 year low of 22 April 2024

| Level | Comment | Level | Comment | |||||
|---|---|---|---|---|---|---|---|---|
| R4 | 1.2500 | ** | break level | S1 | 1.2200 | * | congestion | |
| R3 | 1.2400 | minor congestion | S2 | 1.2095 | ** | November 2023 low | ||
| R2 | 1.2352 | * | 2 Jan (w) low | S3 | 1.2037 | ** | October 2023 (m) low | |
| R1 | 1.2300 | ** | 22 April 2024 (y) low | S4 | 1.2000 | ** | figure |
Asterisk denotes strength of level
08:10 GMT - Choppy trade has met anticipated selling interest at the 1.2300 year low of 22 April 2024, as overbought intraday studies unwind, with sharp losses giving way to fresh consolidation around congestion support at 1.2200. Oversold daily stochastics are flattening, suggesting cautious trade around here, before the negative daily Tension Indicator and bearish weekly charts prompt further losses. A break beneath here will add weigh to sentiment and open up support at the 1.2037 monthly low of October 2023 and congestion around 1.2000. A further close beneath here would turn price action outright negative and confirm continuation of September 2024 losses. Meanwhile, a close above 1.2300, if seen, would turn sentiment neutral and give way to consolidation beneath 1.2352.