Published: 2025-12-18T07:54:07.000Z
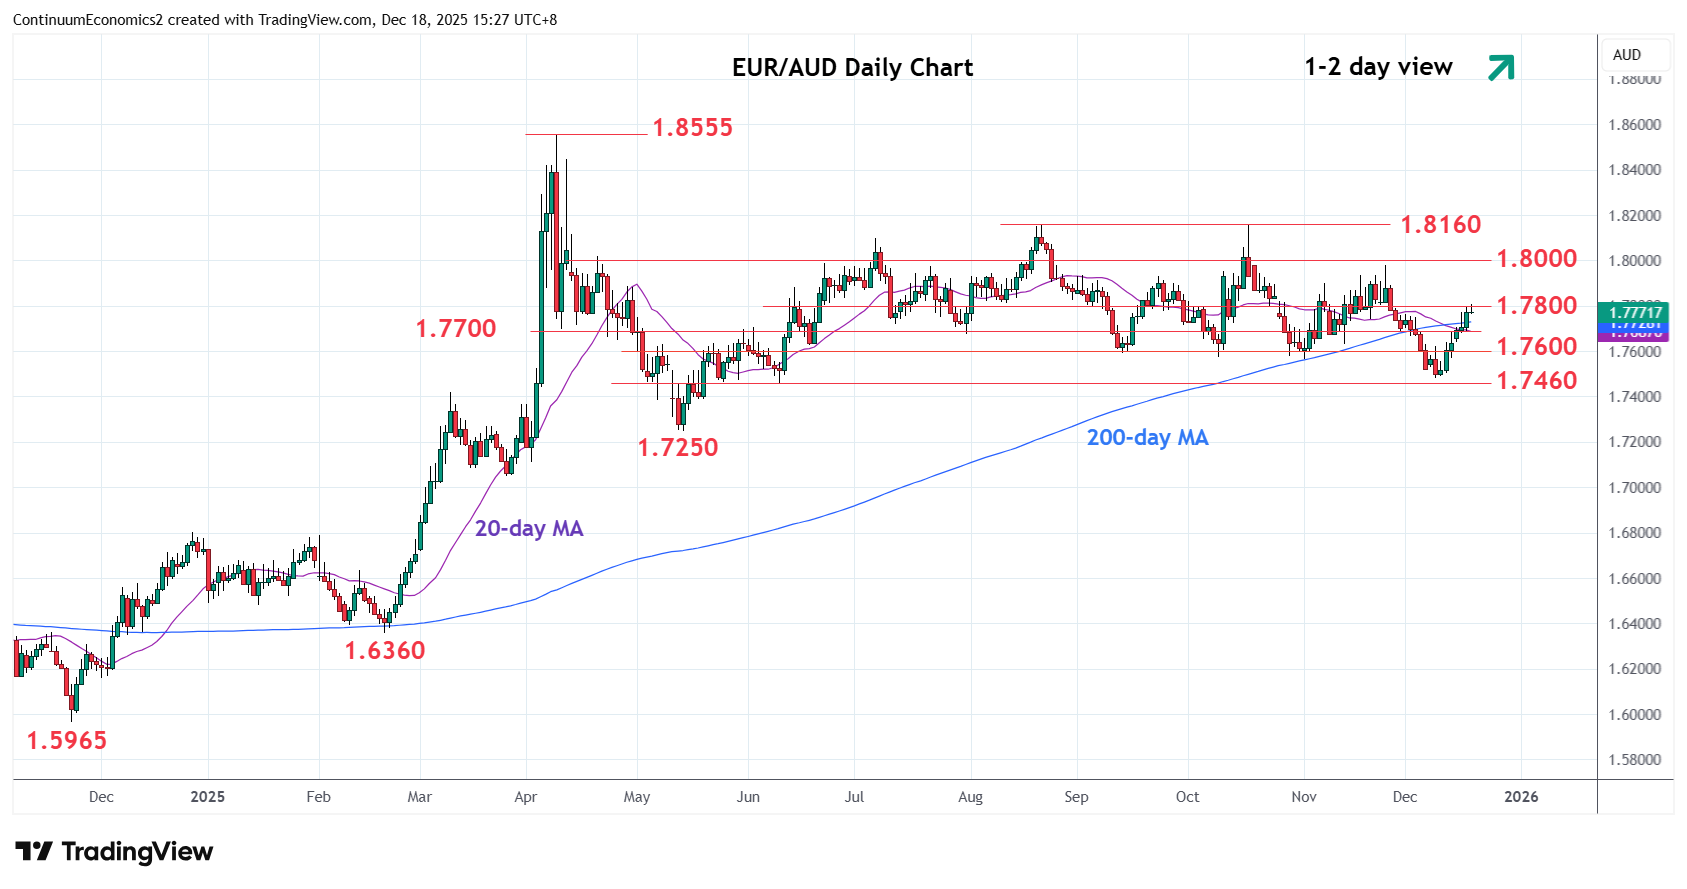
Chart EUR/AUD Update: Extend corrective bounce
-
Extend gains from the 1.7480 low to reach resistance at the 1.7800/20 congestion and 61.8% Fibonacci level
| Levels | Imp | Comment | Levels | Imp | Comment | |||
|---|---|---|---|---|---|---|---|---|
| R4 | 1.8160 | ** | Aug, Oct highs | S1 | 1.7700 | * | congestion | |
| R3 | 1.7978/00 | ** | 25 Nov high, congestion | S2 | 1.7600 | * | congestion | |
| R2 | 1.7900 | * | congestion | S3 | 1.7480 | ** | 9 Dec low | |
| R1 | 1.7800/20 | * | congestion, 61.8% | S4 | 1.7460 | * | Jun low |
Asterisk denotes strength of level
07:45 GMT - Extend gains from the 1.7480 low to reach resistance at the 1.7800/20 congestion and 61.8% Fibonacci level. Overbought daily studies suggest further gains likely to prove limited and give way to renewed selling pressure later. Meanwhile, support is raised to the 1.7700/1.7600 congestion area and break here will expose the 1.7480 low to retest. Below the latter and the 1.7460 support will extend the broader losses from the 1.8160 August/October double top and open up room for extension to the 1.7400 congestion then 1.7250, May low.