Published: 2025-12-10T00:17:50.000Z
Chart AUD/USD Update: Focus on the .6707, September YTD high
-
Little change, as prices settled into consolidation below .6650 congestion
| Levels | Imp | Comment | Levels | Imp | Comment | |||
|---|---|---|---|---|---|---|---|---|
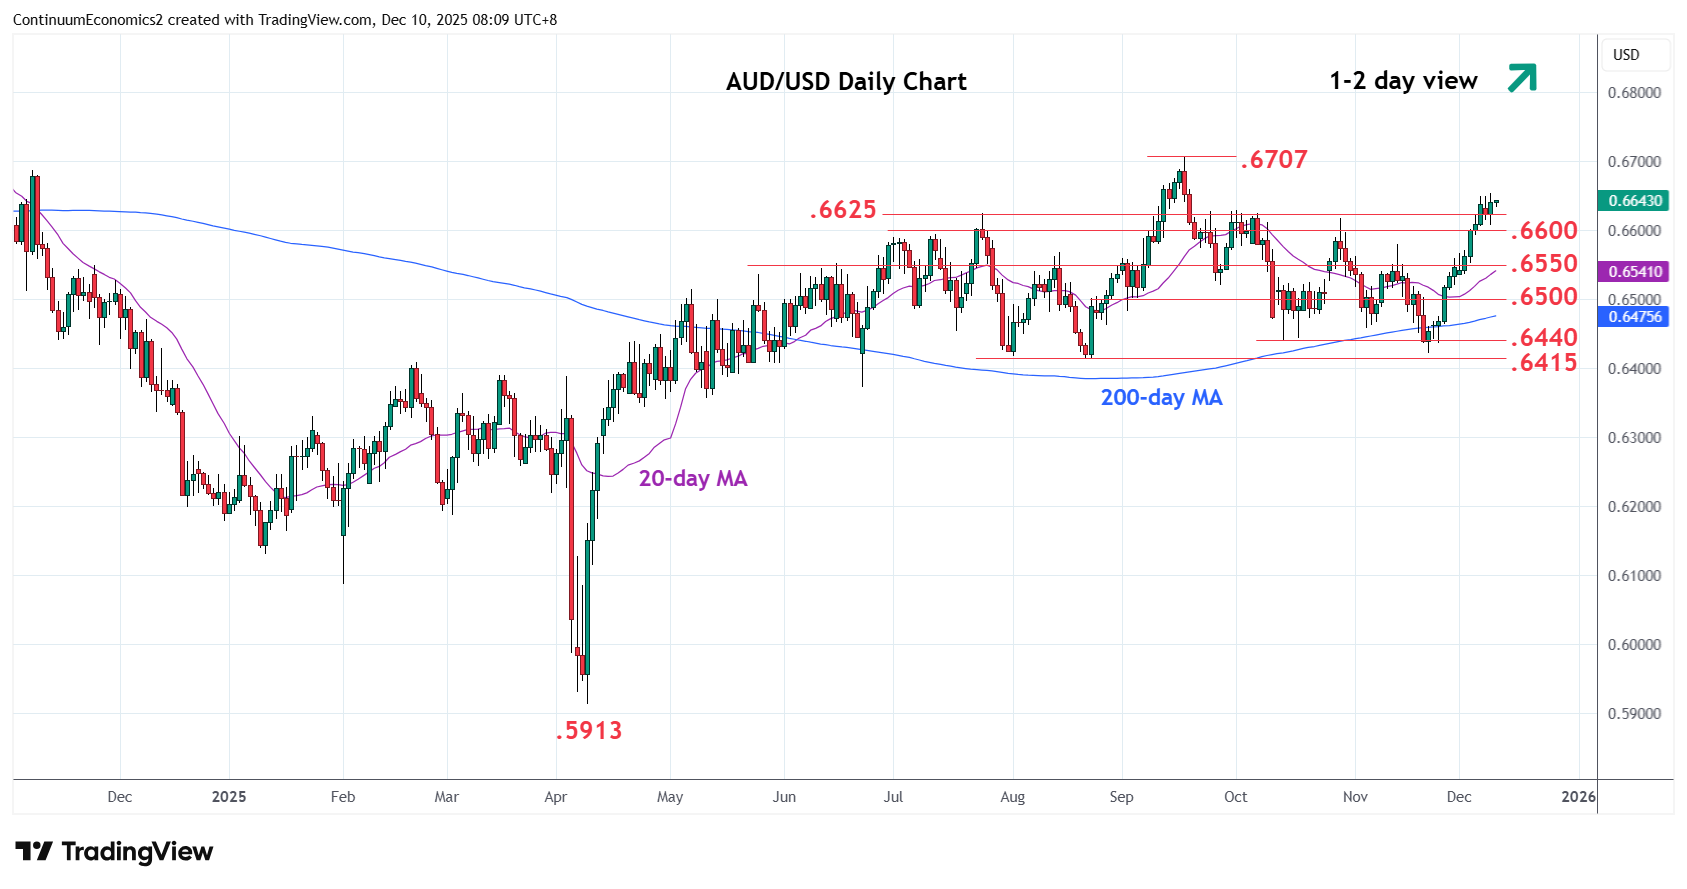
| R4 | 0.6800 | * | congestion | S1 | 0.6625/00 | * | Jul high, congestion | |
| R3 | 0.6750 | * | congestion | S2 | 0.6550 | * | congestion | |
| R2 | 0.6700/07 | ** | figure, 17 Sep YTD high | S3 | 0.6500 | * | congestion | |
| R1 | 0.6650 | * | congestion | S4 | 0.6440/15 | ** | Oct, Aug lows |
Asterisk denotes strength of level
00:10 GMT - Little change, as prices settled into consolidation below .6650 congestion. Pause here see prices unwinding overbought intraday and daily studies following strong gains from the .6421 low but bullish momentum keep pressure on the upside. Clearance will see room for extension to retest the .6707, September current year high. Break here will extend the broader gains from the April low to retrace losses from the September 2024 high. Meanwhile, support is raised to the .6625/00 high of July and congestion which should underpin and sustain gains from the November low.