Chart USD/CAD Update: Further consolidation
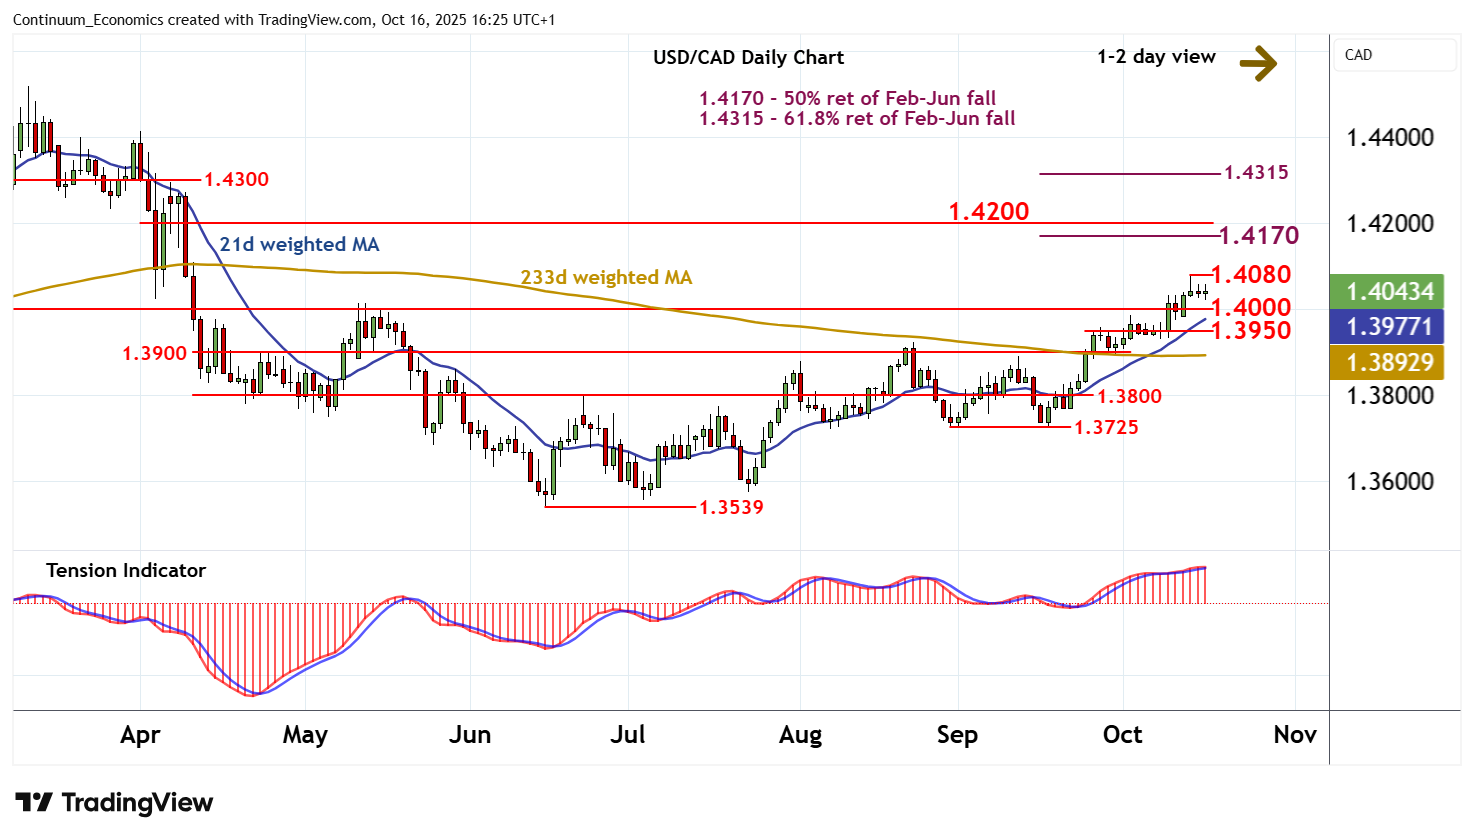
Still little change, as prices extend consolidation beneath resistance at the 1.4080 high of 14 October
| Levels | Imp | Comment | Levels | Imp | Comment | |||
|---|---|---|---|---|---|---|---|---|
| R4 | 1.4300 | * | congestion | S1 | 1.4000 | * | break level | |
| R3 | 1.4200 | ** | break level | S2 | 1.3950 | * | pivot | |
| R2 | 1.4170 | ** | 50% ret of Feb-Jun fall | S3 | 1.3900 | ** | break level | |
| R1 | 1.4080 | * | 14 Oct high | S4 | 1.3800 | * | congestion |
Asterisk denotes strength of level
16:10 BST - Still little change, as prices extend consolidation beneath resistance at the 1.4080 high of 14 October. The rising daily Tension Indicator and overbought daily stochastics are flattening, suggesting room for further consolidation, before positive weekly charts extend June gains still further. A later break above 1.4080 will turn sentiment positive and open up the 1.4170 Fibonacci retracement. But already overbought weekly stochastics could limit any initial tests in profit-taking/consolidation. Meanwhile, support remains at 1.4000. A close beneath here would delay higher levels and give way to consolidation above 1.3950.