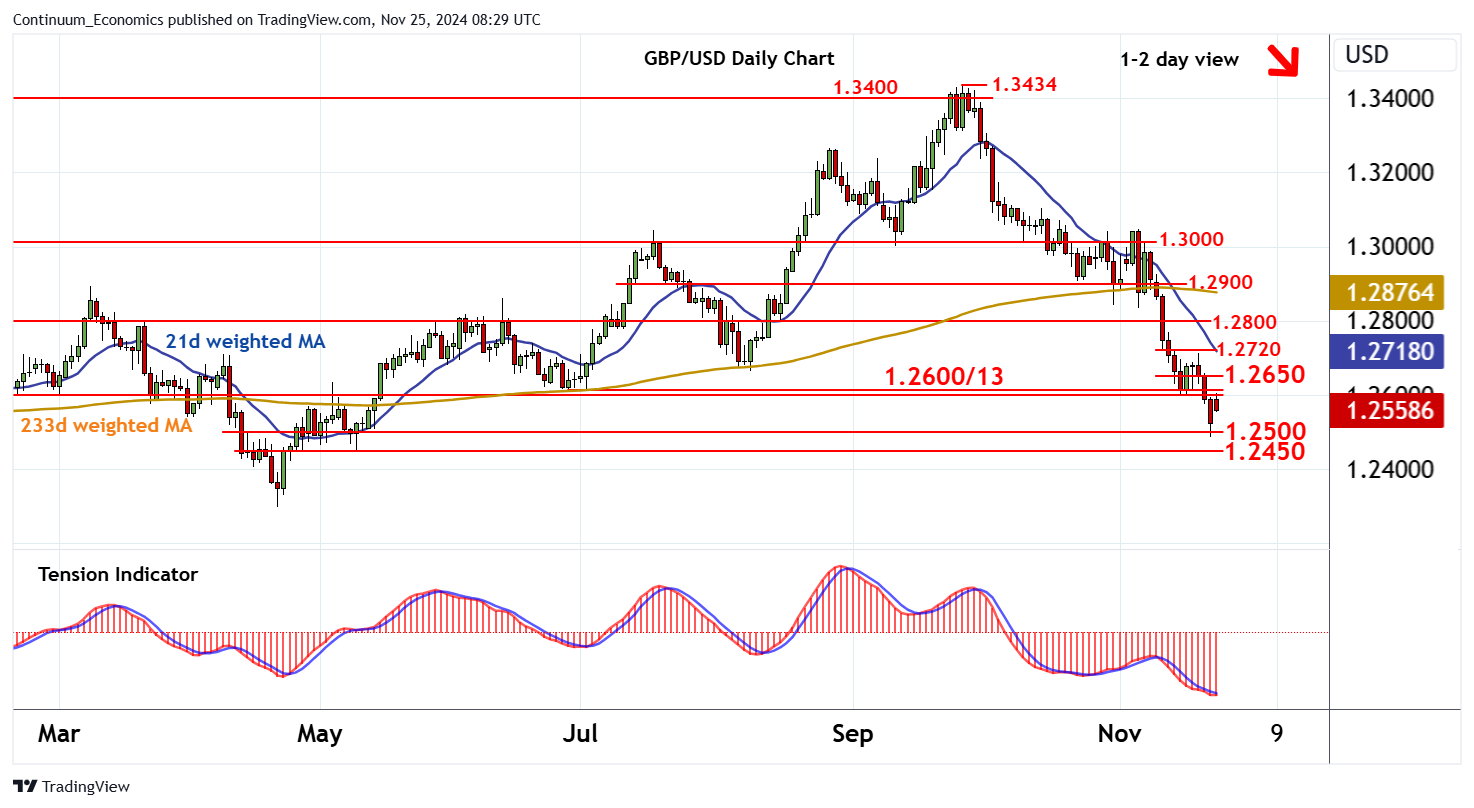
Chart GBP/USD Update: Choppy above 1.2500 - bearish daily studies stabilising
The anticipated test of congestion support at 1.2500 has extended to 1.2487

| Level | Comment | Level | Comment | |||||
|---|---|---|---|---|---|---|---|---|
| R4 | 1.2768 | 13 Nov high | S1 | 1.2500 | ** | congestion | ||
| R3 | 1.2720 | break level | S2 | 1.2487 | ** | 22 Nov (w) low | ||
| R2 | 1.2650 | congestion | S3 | 1.2450 | congestion | |||
| R1 | 1.2600/13 | * | cong; 27 Jun (m) low | S4 | 1.2400 | * | congestion |
Asterisk denotes strength of level
08:05 GMT - The anticipated test of congestion support at 1.2500 has extended to 1.2487, where rising intraday studies are have prompted a bounce back to resistance within 1.2600/13. A fresh pullback is developing from here, but flattening oversold daily stochastics and the flattening daily Tension Indicator suggest any immediate test of the 1.2487/00 support could give way to further short-covering and consolidation. Broader weekly stochastics are also flattening in oversold areas, but the weekly Tension Indicator is under pressure and longer-term studies are also falling, pointing to room for a later break beneath here and continuation of September losses towards 1.2450. Meanwhile, a close above 1.2600/13, if seen, would help to further stabilise price action and give way to consolidation beneath congestion around 1.2650.