Published: 2026-05-14T16:01:21.000Z
Chart USD/CAD Update: Pushing higher
2
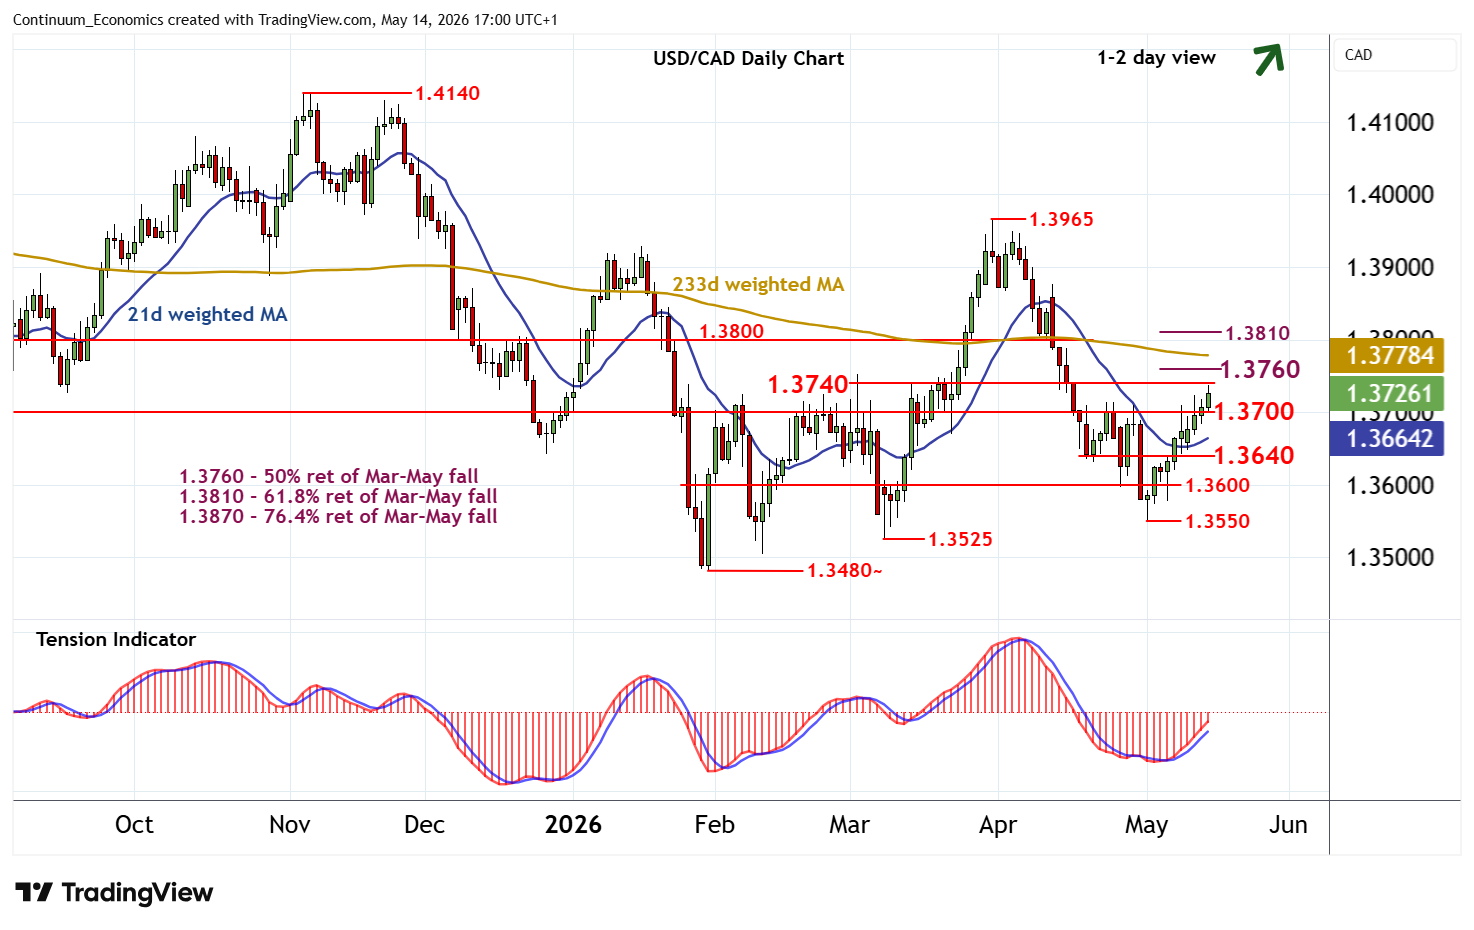
The anticipated test of resistance at 1.3740 is giving way to consolidation
| Levels | Imp | Comment | Levels | Imp | Comment | |||
|---|---|---|---|---|---|---|---|---|
| R4 | 1.3840 | intraday break level | S1 | 1.3700 | ** | congestion | ||
| R3 | 1.3800/10 | ** | congestion; 61.8% ret | S2 | 1.3640 | break level | ||
| R2 | 1.3760 | ** | 50% ret of Mar-May fall | S3 | 1.3600 | ** | congestion | |
| R1 | 1.3740 | * | break level | S4 | 1.3550 | * | 1 May (w) low |
Asterisk denotes strength of level
16:40 BST - The anticipated test of resistance at 1.3740 is giving way to consolidation, with prices currently trading around 1.3725. The daily Tension Indicator continues to rise, suggesting room for continuation towards the 1.3760 Fibonacci retracement. However, flattening overbought daily stochastics and mixed weekly charts could limit any initial tests in consolidation. A break, however, will improve sentiment and extend gains towards strong resistance within 1.3800/10. Meanwhile, support remains at congestion around 1.3700. A close beneath here would help to stabilise price action and prompt consolidation above 1.3640.