Continuum Economics
  • Search
  • About Us
  • Buy
  • Invite A Friend
  • My Basket
  • Articles
  • Calendar
  • Forecasts
  • Events
  • Data
  • Newsletters
  • My Alerts
  • Community
  • Directory
  • About Us
  • Buy
  • Invite A Friend
  • My Basket
  • Articles
    • All
    • Thematic
    • Tactical
    • Asia
    • EMEA
    • Americas
    • Newsletters
    • Freemium
    • Editor's Choice
    • Most Viewed
    • Most Shared
    • Most Liked
  • Calendar
    • Interactive
      • China
      • United States
      • Eurozone
      • United Kingdom
    • Month Ahead
    • Reviews
    • Previews
  • Forecasts
    • Forecasts
    • Key Views
  • Events
    • Media
    • Conference Calls
  • Data
    • Country Insights
    • Shadow Credit Ratings
    • Full CI Data Download
  • Newsletters
  • My Alerts
  • Community
    • FX
    • Fixed Income
    • Macro Strategy
    • Credit Markets
    • Equities
    • Commodities
    • Precious Metals
    • Renewables
  • Directory
  • My Account
  • Notifications Setup
  • Administration Panel
  • Account Details
  • Recent Devices
  • Distribution Lists
  • Shared Free Trials
  • Saved Articles
  • Shared Alerts
  • My Posts
Published: 2025-09-08T08:00:50.000Z

Chartbook: Chart Shanghai Shenzhen CSI 300: Extending gains from 2024 double bottom

byPakLai Ng

Technical Analyst
98

Break of the 4000 level at the start of Q3 saw sharp gains through resistance at the 4400 level and the 4450, October 2024 year high.

Break of the 4000 level at the start of Q3 saw sharp gains through resistance at the 4400 level and the 4450, October 2024 year high.

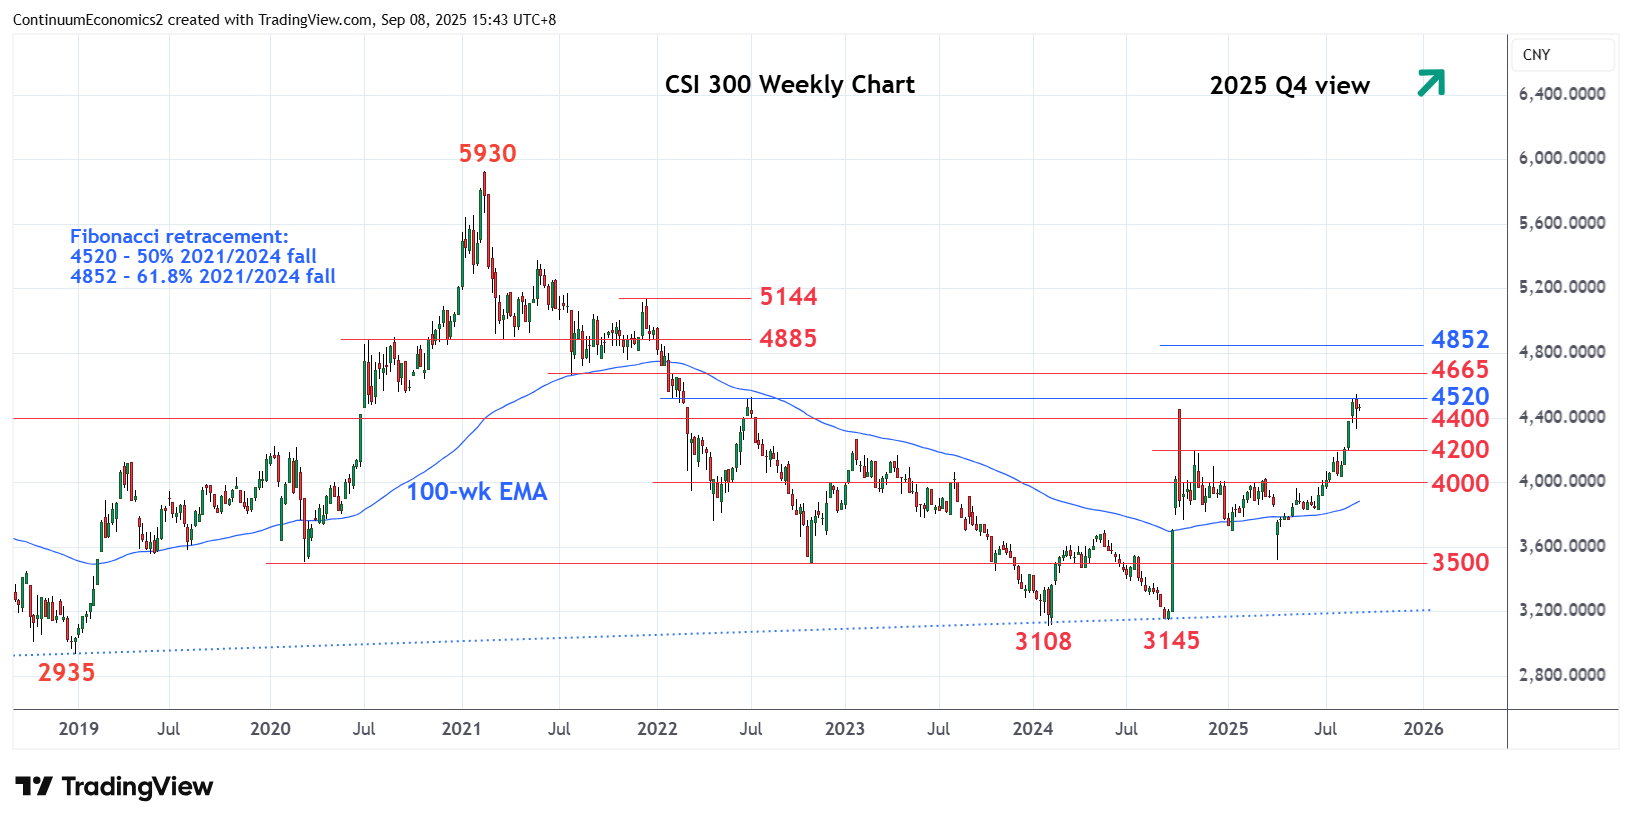
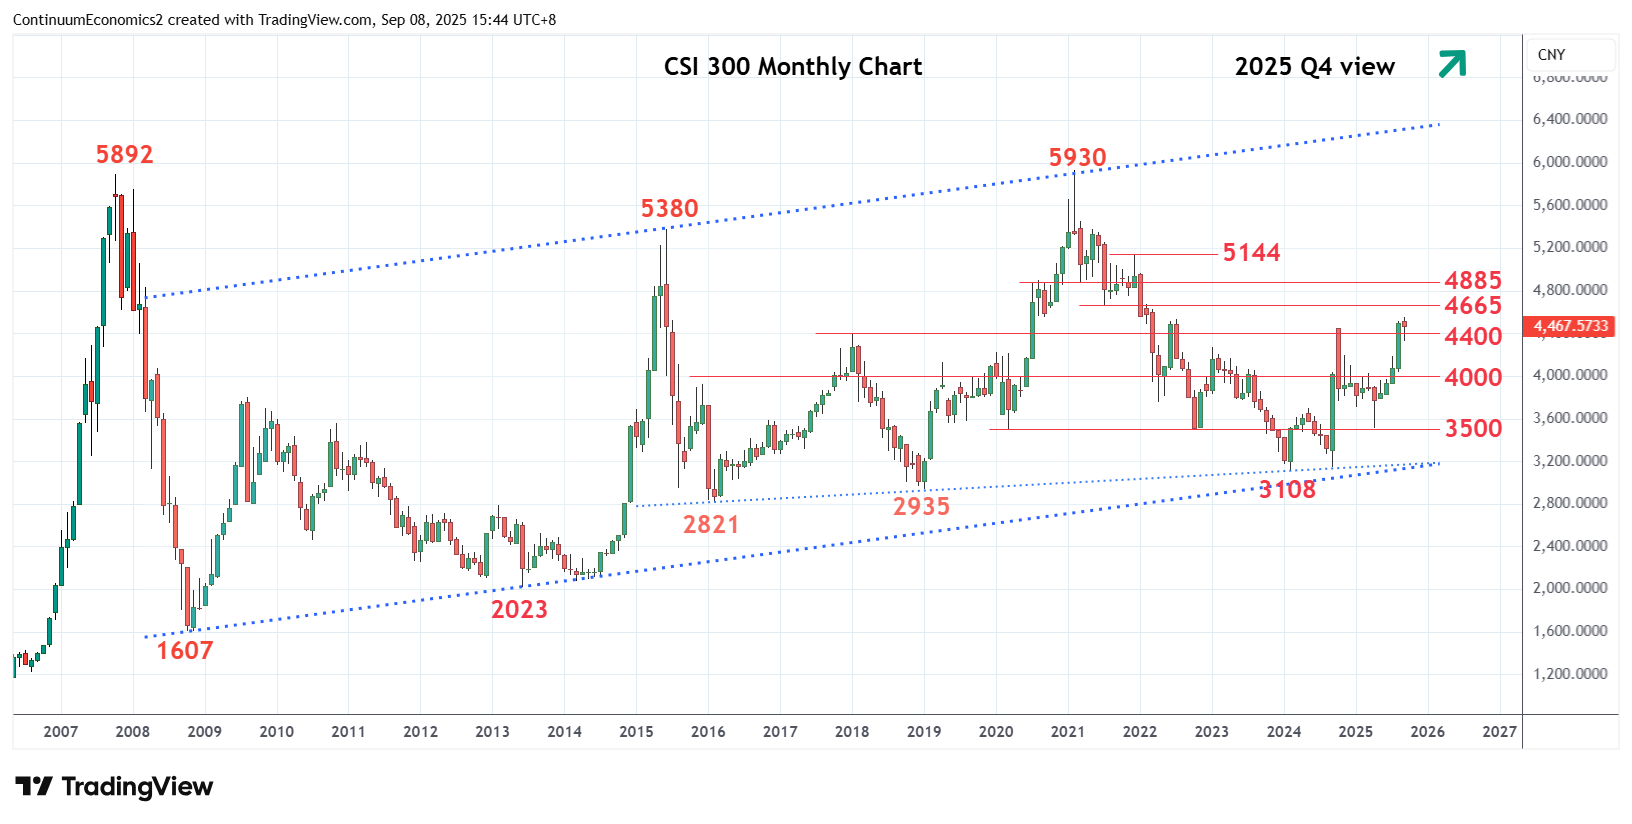
Pushed above these has seen further gains to retrace 50% of the 2021/2024 losses to reach 4520 level. Prices has since settled back to consolidate the strong rally from the April low. However, bullish structure from the 3108 and 3145, the double bottom of the 2024 year lows, suggest room for further gains within the broad rising channel from the 2008 year low. Break above the 4520 Fibonacci level will see room to target support turned resistance at 4665, the 2021 year low. Higher still, will see extension to 4852, 61.8% Fibonacci level, and 4885 resistance then the 5000 psychological level.

Meanwhile, support is at the 4200, high of November 2024. Below this will open up room for deeper correction to the 4100 level and extending to the 4000 congestion.


4Cast Ltd. and all of its affiliates (Continuum Economics) do not conduct “investment research” as defined in the FCA Conduct of Business Sourcebook (COBS) section 12 nor do they provide “advice about securities” as defined in the Regulation of Investment Advisors by the U.S. SEC. Continuum Economics is not regulated by the SEC or by the FCA or by any other regulatory body. This research report has not been prepared in accordance with legal requirements designed to promote the independence of investment research and is not subject to any prohibition on dealing ahead of the dissemination of investment research. Nonetheless, Continuum Economics has an internal policy that prohibits “front-running” and that is designed to minimize the risk of receiving or misusing confidential or potentially material non-public information. The views and conclusions expressed here may be changed without notice. Continuum Economics, its partners and employees make no representation about the completeness or accuracy of the data, calculations, information or opinions contained in this report. This report may not be copied, redistributed or reproduced in part or whole without Continuum Economics’s express permission. Information contained in this report or relied upon in its construction may previously have been disclosed under a consulting agreement with one or more clients. The prices of securities referred to in the report may rise or fall and past performance and forecasts should not be treated as a reliable indicator of future performance or results. This report is not directed to you if Continuum Economics is barred from doing so in your jurisdiction. Nor is it an offer or solicitation to buy or sell securities or to enter into any investment transaction or use any investment service.
Analyst Declaration
I,PakLai Ng, the Technical Analyst declare that the views expressed herein are mine and are clear, fair and not misleading at the time of publication. They have not been influenced by any relationship, either a personal relationship of mine or a relationship of the firm, to any entity described or referred to herein nor to any client of Continuum Economics nor has any inducement been received in relation to those views. I further declare that in the preparation and publication of this report I have at all times followed all relevant Continuum Economics compliance protocols including those reasonably seeking to prevent the receipt or misuse of material non-public information.
Topics
CN CSI300-TA
Technical Analysis
ChartBook

GENERAL

  • Home
  • About Us
  • Our Team
  • Careers

LEGAL

  • Terms and Conditions
  • Privacy Policy
  • Compliance
  • GDPR

GET IN TOUCH

  • Contact Us
Continuum Economics
The Technical Analyst Awards Winner 2021
The Technical Analyst Awards Finalist 2020
image