Published: 2025-11-20T12:06:12.000Z
Chart USD/ZAR Update: Limited tests higher
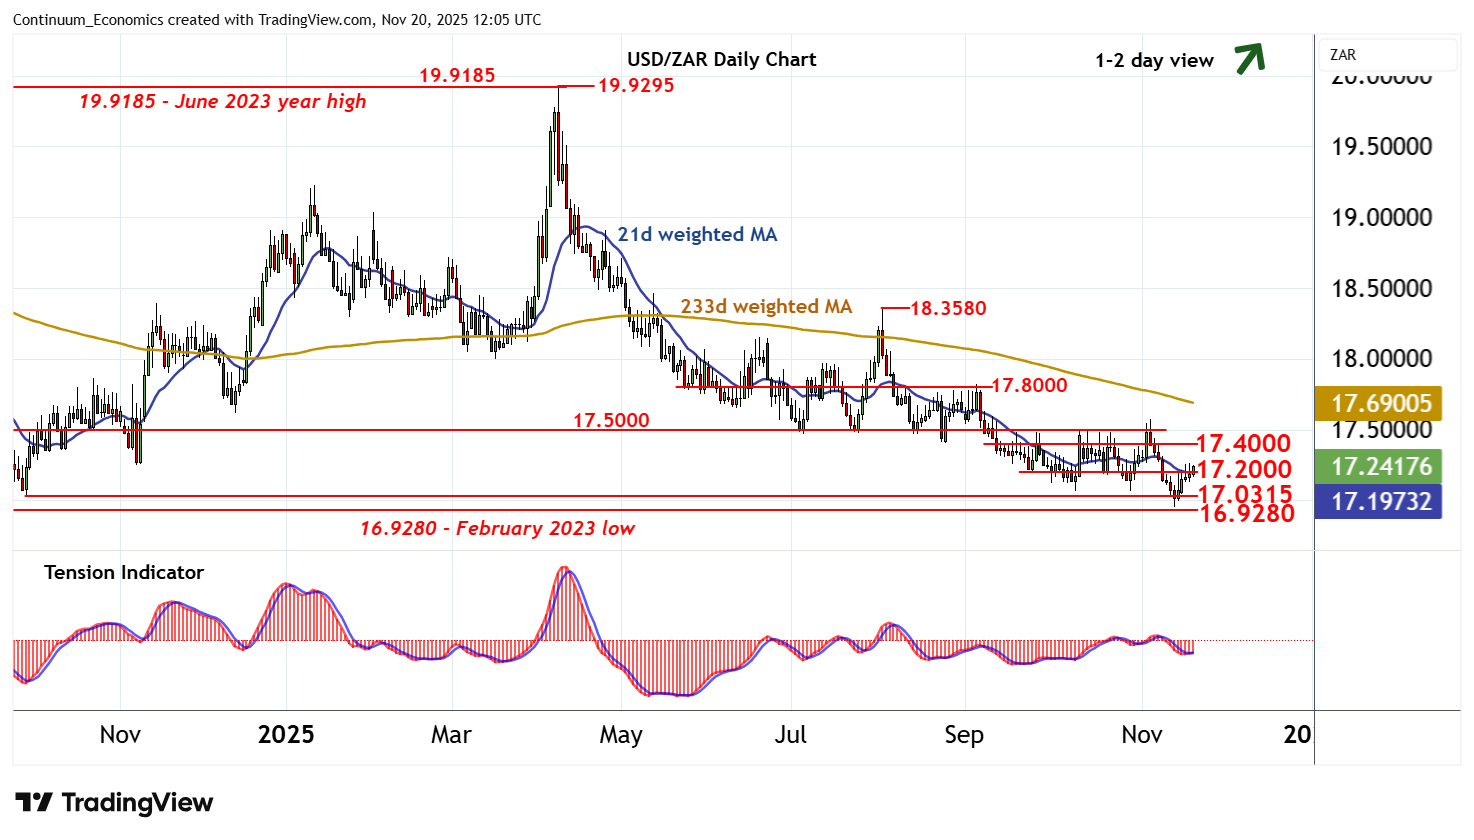
1
The anticipated drift lower towards critical support within 16.9280 - 17.0315 has not been seen
| Level | Comment | Level | Comment | |||||
|---|---|---|---|---|---|---|---|---|
| R4 | 17.5625 | ** | 38.2% ret of Aug-Oct fall | S1 | 17.0315 | ** | 30 Sep 2024 (y) low | |
| R3 | 17.5000 | ** | congestion | S2 | 17.0000 | ** | congestion | |
| R2 | 17.4000 | * | congestion | S3 | 16.9495 | ** | 13 Nov YTD low | |
| R1 | 17.2000 | * | congestion | S4 | 16.9280 | February 2023 low |
Asterisk denotes strength of level
12:00 GMT - The anticipated drift lower towards critical support within 16.9280 - 17.0315 has not been seen, as prices extend cautious trade around congestion resistance at 17.2000. Daily readings are rising, highlighting potential for a test of congestion resistance at 17.4000. But mixed weekly charts should limit any further strength in renewed selling interest/consolidation beneath 17.5000. Meanwhile, a close below 16.9280 - 17.0315, not yet seen, will turn sentiment negative and confirm continuation of May 2023 losses.