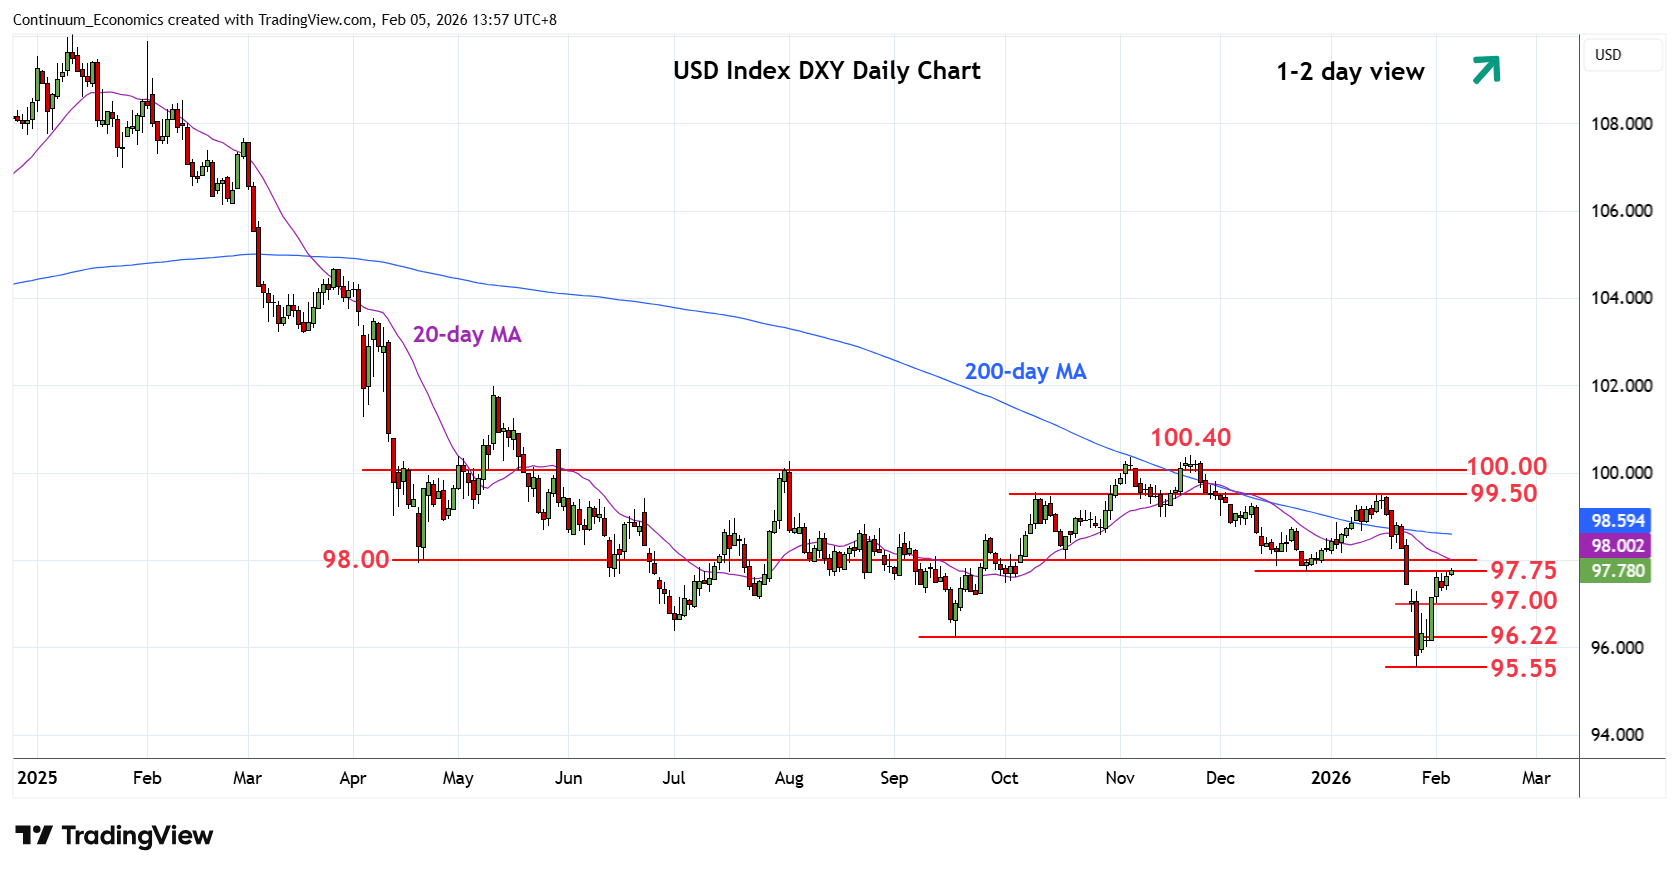
Chart USD Index DXY Update: Pressuring 97.75/98.00 resistance
Break above resistance at the 97.33/97.42 gap area see prices extending gains to pressure strong resistance at the 97.75/98.00 area
| Levels | Imp | Comment | Levels | Imp | Comment | |||
|---|---|---|---|---|---|---|---|---|
| R4 | 99.00 | * | congestion | S1 | 97.00 | * | congestion | |
| R3 | 98.50 | * | congestion | S2 | 96.50 | * | congestion | |
| R2 | 98.00 | ** | congestion | S3 | 96.22 | * | Sep low | |
| R1 | 97.75 | ** | Dec low, congestion | S4 | 95.55 | ** | 27 Jan YTD low |
Asterisk denotes strength of level
06:20 GMT - Break above resistance at the 97.33/97.42 gap area see prices extending gains to pressure strong resistance at the 97.75/98.00 area which is expected to cap. Break here, if seen, will open up room for stronger gains to the 98.50/99.00 congestion area. Corrective gains are expected give way to renewed selling pressure later with support starting at the 97.00 congestion. Would take break here to open up room for retest of support at the 96.50/22 congestion and September low. Below this will return focus to the 95.55 low and see room to further extend the broader losses from 2022 year high.