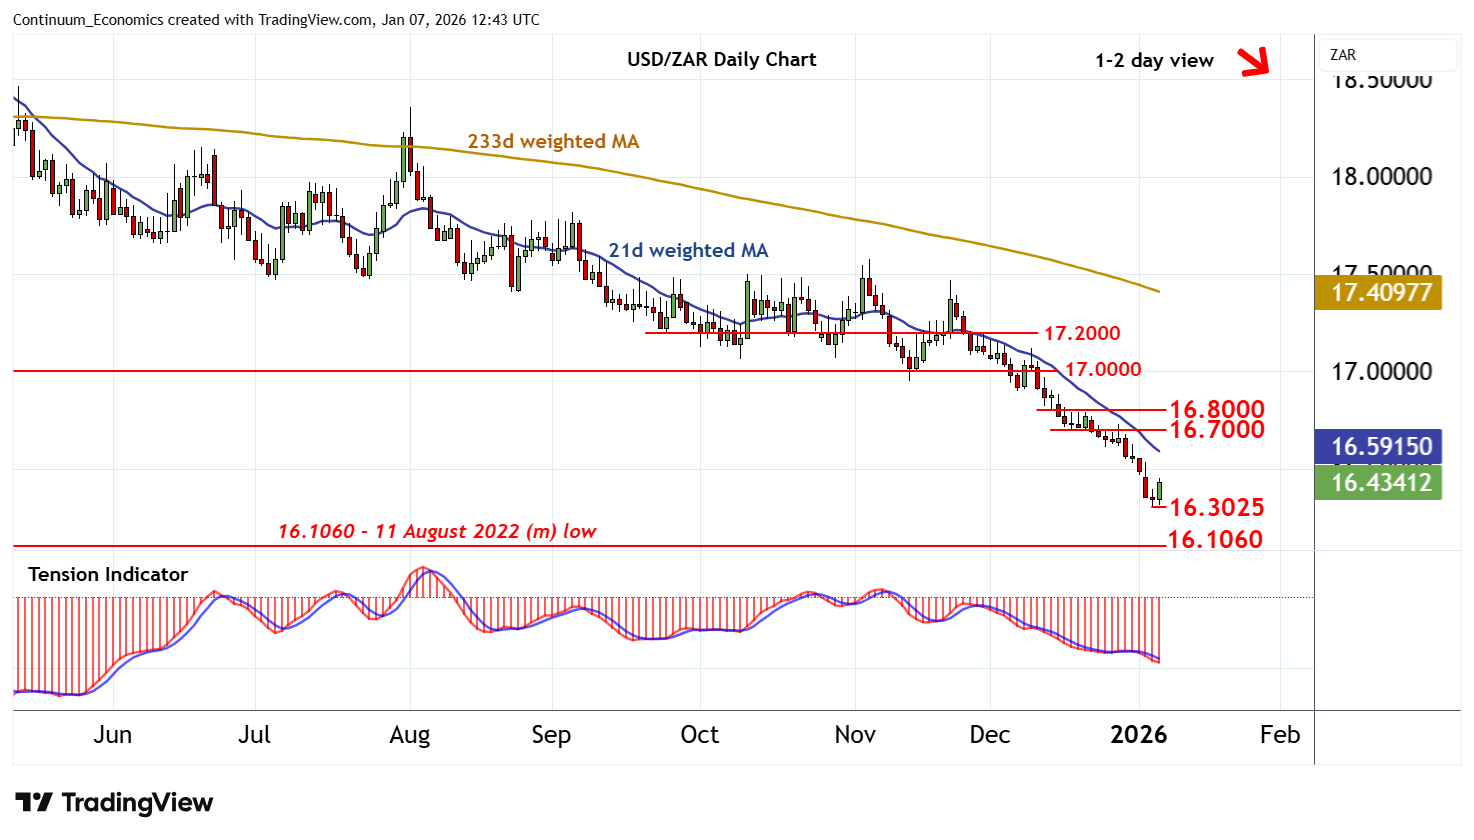
Chart USD/ZAR Update: Limited tests higher
Consolidation above the 16.3025 current year low of 6 January is giving way to a bounce
| Level | Comment | Level | Comment | |||||
|---|---|---|---|---|---|---|---|---|
| R4 | 17.2000 | * | congestion | S1 | 16.3025 | 6 Jan YTD low | ||
| R3 | 17.0000 | ** | congestion | S2 | 16.1060 | ** | 11 Aug 2022 (m) low | |
| R2 | 16.8000 | break level | S3 | 16.0000 | ** | congestion | ||
| R1 | 16.7000 | break level | S4 | 15.8800 | ** | 61.8% ret of 2021-2023 rally |
Asterisk denotes strength of level
12:20 GMT - Consolidation above the 16.3025 current year low of 6 January is giving way to a bounce, with prices currently trading around 16.4250. Rising intraday studies and a tick higher in oversold daily stochastics suggests room for continuation higher. But the bearish daily Tension Indicator and negative longer-term charts are expected to limit scope in renewed selling interest beneath 16.7000. Following cautious/corrective trade, fresh losses are looked for. A break below 16.3025 will add weight to sentiment and extend the April bear trend towards the 16.1060 monthly low of 11 August 2022 and historic congestion around 16.0000. Just lower is the 15.8800 Fibonacci retracement. But flat oversold weekly stochastics are expected to limit any initial tests of this broad 15.8800 - 16.1060 range in short-covering/consolidation.