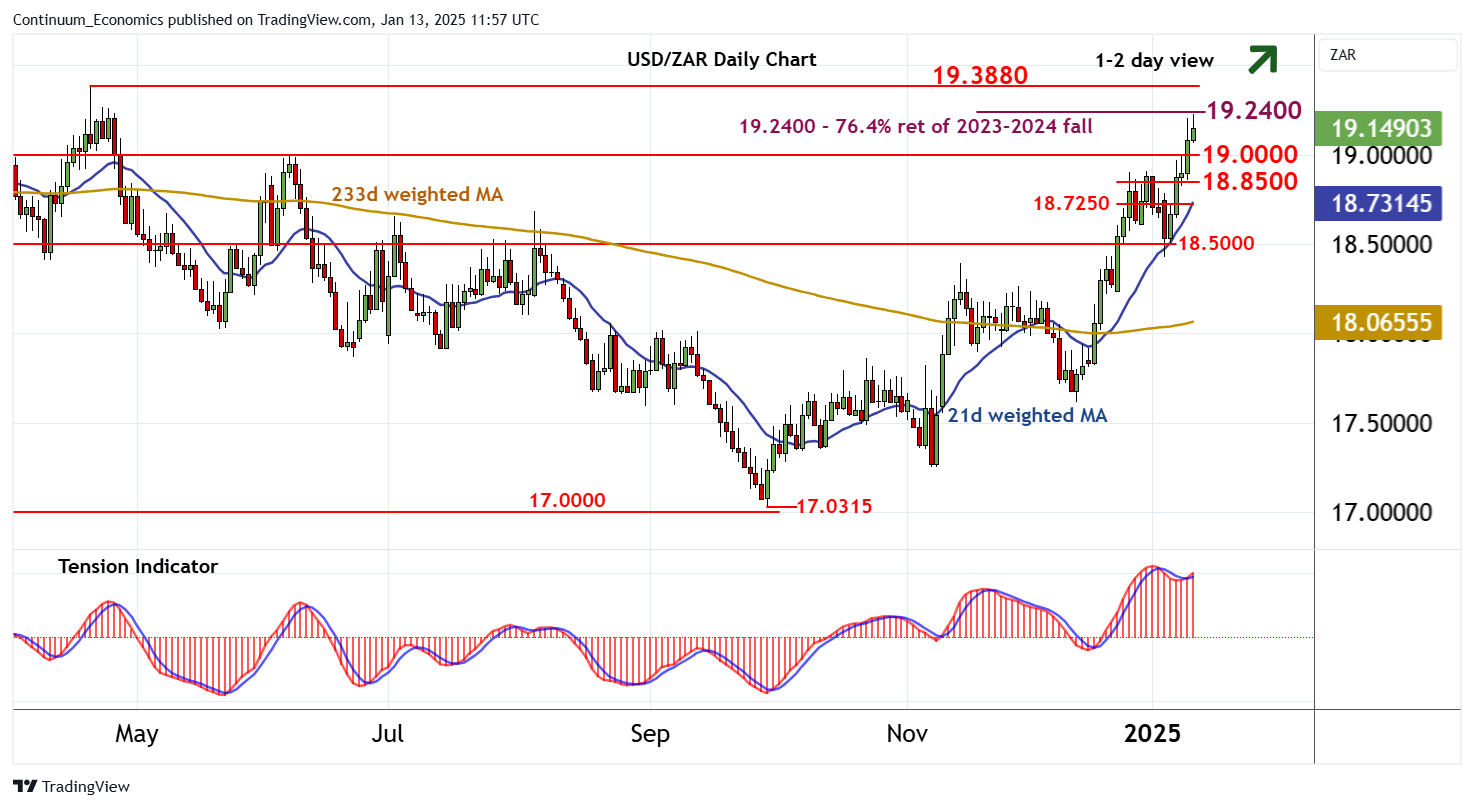
Chart USD/ZAR Update: Consolidating test of the 19.2400 Fibonacci retracement

The anticipated break above 19.0000 has extended September gains towards strong resistance at the 19.2400 Fibonacci retracement
| Level | Comment | Level | Comment | |||||
|---|---|---|---|---|---|---|---|---|
| R4 | 19.6380 | ** | October 2023 (m) high | S1 | 19.0000 | ** | congestion | |
| R3 | 19.4430 | mid-Oct 2023 (w) high | S2 | 18.8500 | break level | |||
| R2 | 19.3880 | ** | 19 Apr 2024 (m) high | S3 | 18.7250 | congestion | ||
| R1 | 19.2400 | ** | 76.4% ret of 2023-2024 fall | S4 | 18.6000 | * | break level |
Asterisk denotes strength of level
11:30 GMT - The anticipated break above 19.0000 has extended September gains towards strong resistance at the 19.2400 Fibonacci retracement. Unwinding overbought intraday studies are prompting consolidation beneath here. But daily readings continue to strengthen, highlighting room for a later test above here. Subsequent focus will then turn to the 19.3880 monthly high of 19 April 2024, but flattening overbought daily stochastics are expected to limit any initial tests in profit-taking/consolidation. Meanwhile, a break back below 19.0000 will open up support within the 18.750 - 18.8500 area, where fresh consolidation is expected to appear.