Published: 2026-02-03T00:24:09.000Z
Chart AUD/USD Update: Consolidating above .6900 support
1
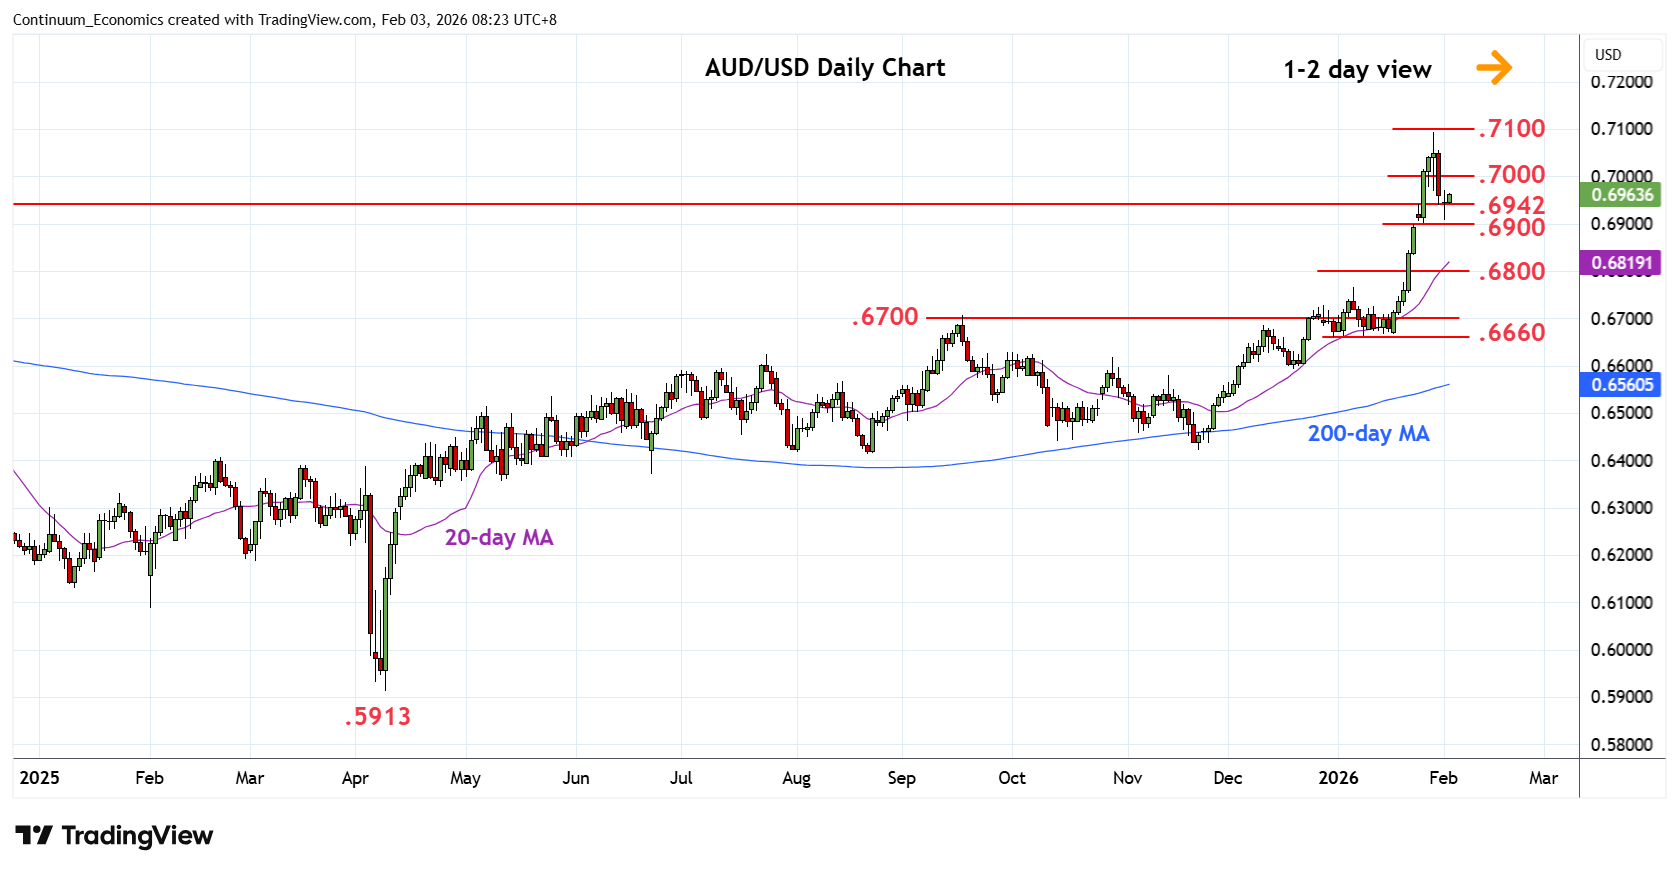
Turned up from above the .6900 support as prices consolidate pullback from the .7094 high of last week
| Levels | Imp | Comment | Levels | Imp | Comment | |||
|---|---|---|---|---|---|---|---|---|
| R4 | 0.7158 | ** | Feb 2023 year high | S1 | 0.6942 | * | 2024 year high | |
| R3 | 0.7094 | ** | 29 Jan YTD high | S2 | 0.6900 | ** | 23 Jan high, gap | |
| R2 | 0.7050 | * | congestion | S3 | 0.6850 | * | congestion | |
| R1 | 0.7000 | * | congestion | S4 | 0.6800 | * | congestion |
Asterisk denotes strength of level
00:20 GMT - Turned up from above the .6900 support as prices consolidate pullback from the .7094 high of last week. Daily studies are tracking lower to unwind overbought readings and deeper corrective pullback to retrace gains from the .6660 low cannot be ruled out. Break of support at the .6900 level will open up room for deeper pullback to .6850/.6800 support. Meanwhile, resistance is lowered to the .7000 level which is now expected to cap. Would take break here to revive the upside focus and open up the .7094 high to retest and see scope to extend the broader April gains.