Continuum Economics
  • Search
  • About Us
  • Buy
  • Invite A Friend
  • My Basket
  • Articles
  • Calendar
  • Forecasts
  • Events
  • Data
  • Newsletters
  • My Alerts
  • Community
  • Directory
  • About Us
  • Buy
  • Invite A Friend
  • My Basket
  • Articles
    • All
    • Thematic
    • Tactical
    • Asia
    • EMEA
    • Americas
    • Newsletters
    • Freemium
    • Editor's Choice
    • Most Viewed
    • Most Shared
    • Most Liked
  • Calendar
    • Interactive
      • China
      • United States
      • Eurozone
      • United Kingdom
    • Month Ahead
    • Reviews
    • Previews
  • Forecasts
    • Forecasts
    • Key Views
  • Events
    • Media
    • Conference Calls
  • Data
    • Country Insights
    • Shadow Credit Ratings
    • Full CI Data Download
  • Newsletters
  • My Alerts
  • Community
    • FX
    • Fixed Income
    • Macro Strategy
    • Credit Markets
    • Equities
    • Commodities
    • Precious Metals
    • Renewables
  • Directory
  • My Account
  • Notifications Setup
  • Administration Panel
  • Account Details
  • Recent Devices
  • Distribution Lists
  • Shared Free Trials
  • Saved Articles
  • Shared Alerts
  • My Posts
Published: 2025-09-15T10:04:56.000Z

Chartbook: US Chart 10 Year Yield: Consolidating - background studies leaning lower

0
-

Little change, as prices extend anticipated consolidation above congestion support at 4.000%

Little change, as prices extend anticipated consolidation above congestion support at 4.000%.

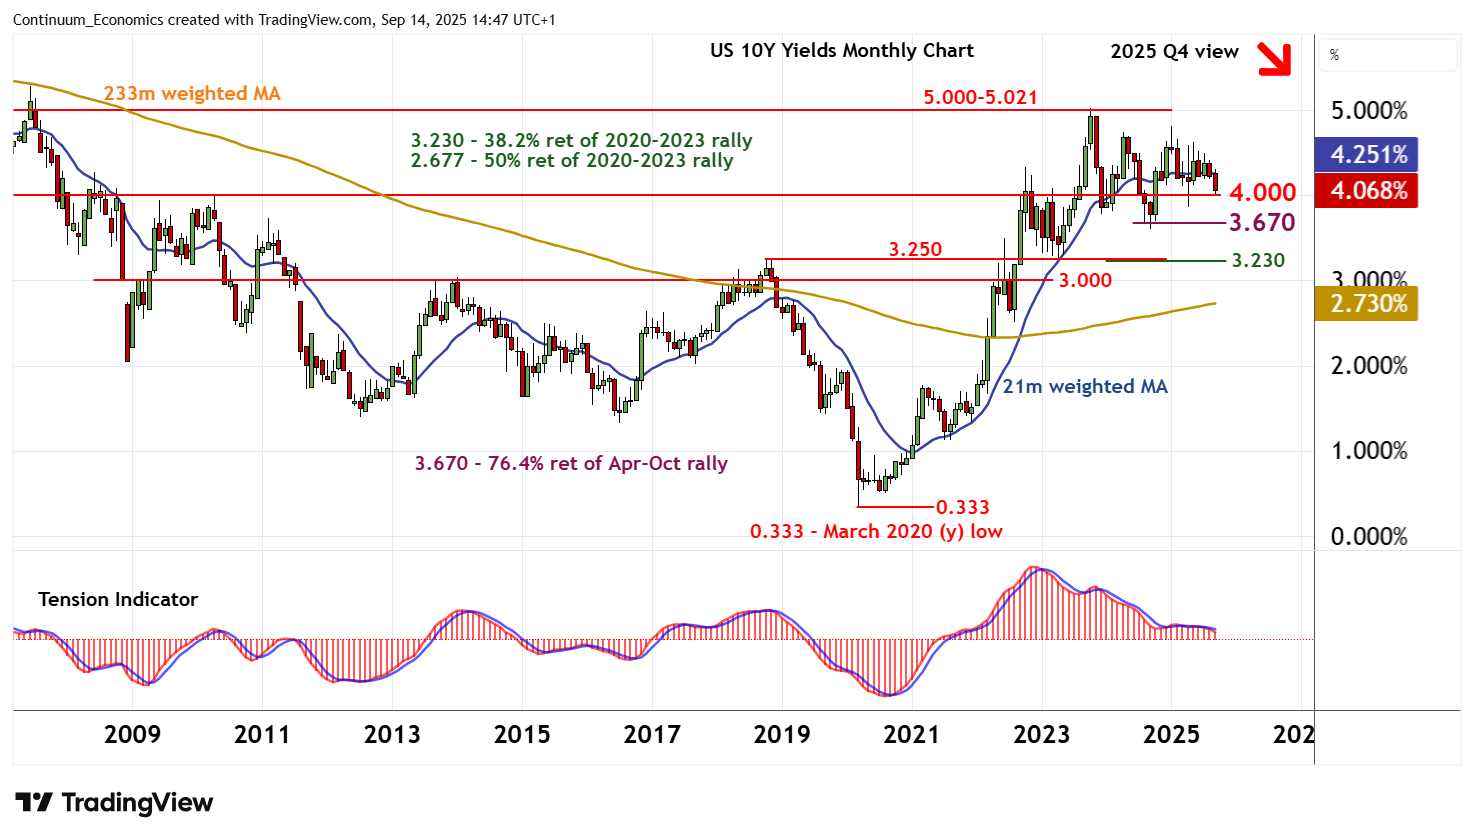
Monthly studies continues to track lower, highlighting room for a break and a test of critical support at the 3.670% Fibonacci retracement and the 3.599% year low of September 2024.

Already oversold weekly studies could limit any initial tests of this range in fresh consolidation.

But the bearish monthly studies and deteriorating longer-term readings highlight room for still deeper losses into the coming months.

A later close beneath here will turn sentiment outright negative and confirm a near-term top in place at the 5.021% multi-year high of October 2023. A deeper correction of the 2020-2023 rally will then open up support at the 3.230% Fibonacci retracement and the 3.250% year high of October 2018.

Meanwhile, resistance is up to congestion around 4.500%.

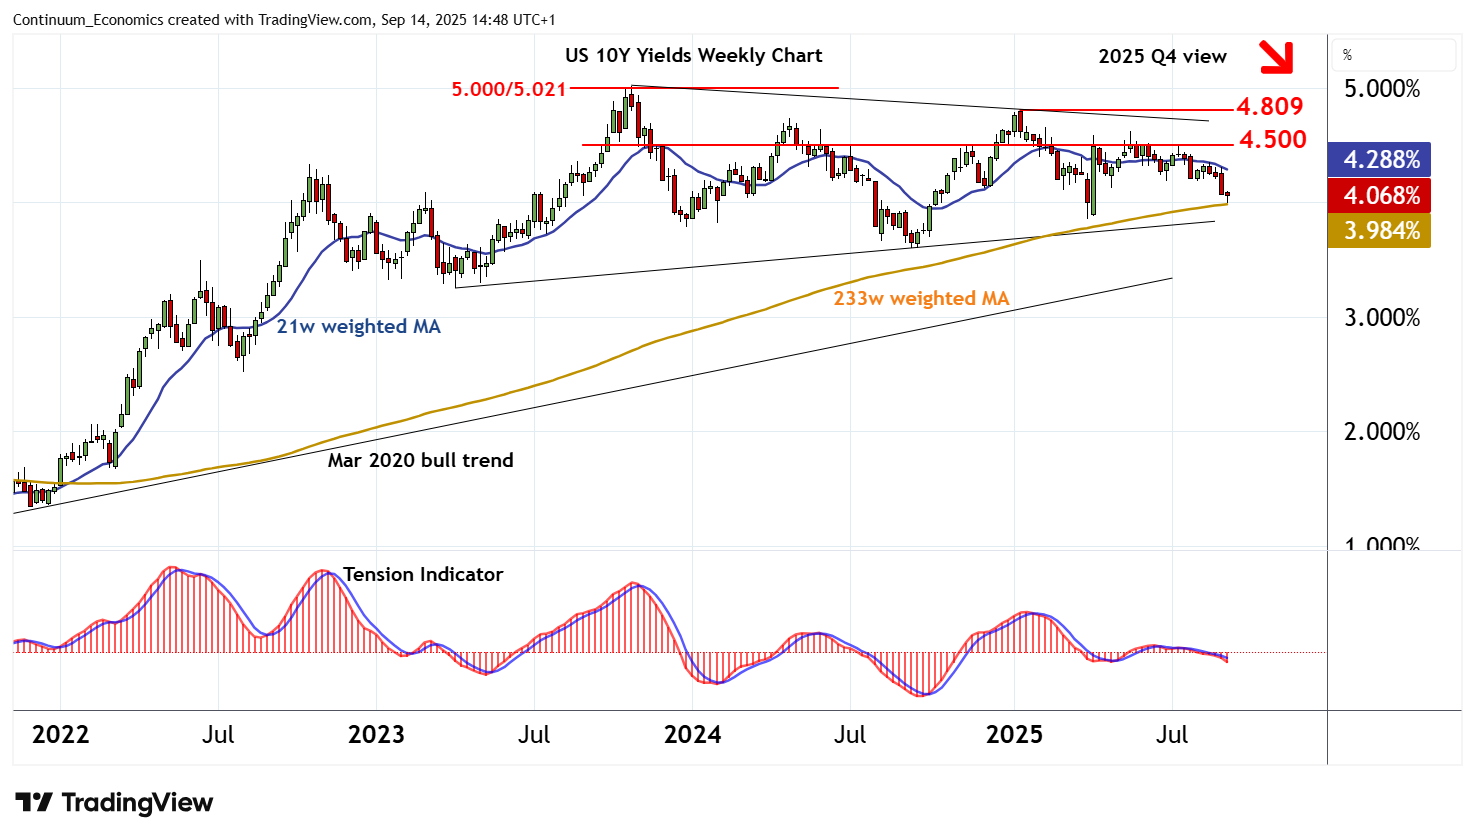
Negative weekly stochastics and the bearish weekly Tension Indicator are expected to limit any bounce from current levels in renewed selling interest towards here.

A break, if seen, will help to stabilise price action and prompt consolidation beneath strong resistance at the 4.809% current year high of 14 January.

Critical resistance is at congestion around 5.000% and the 5.02% year high of October 2023.

A close above here is needed to turn sentiment positive and confirm continuation of the March 2020 bull trend.

Continue to read the article for free
Login

or

or

Topics
Technical Analysis
ChartBook

GENERAL

  • Home
  • About Us
  • Our Team
  • Careers

LEGAL

  • Terms and Conditions
  • Privacy Policy
  • Compliance
  • GDPR

GET IN TOUCH

  • Contact Us
Continuum Economics
The Technical Analyst Awards Winner 2021
The Technical Analyst Awards Finalist 2020
image