Published: 2026-02-04T01:35:30.000Z
Chart GBP/USD Update: Higher in range from 1.3623, Monday's low
1
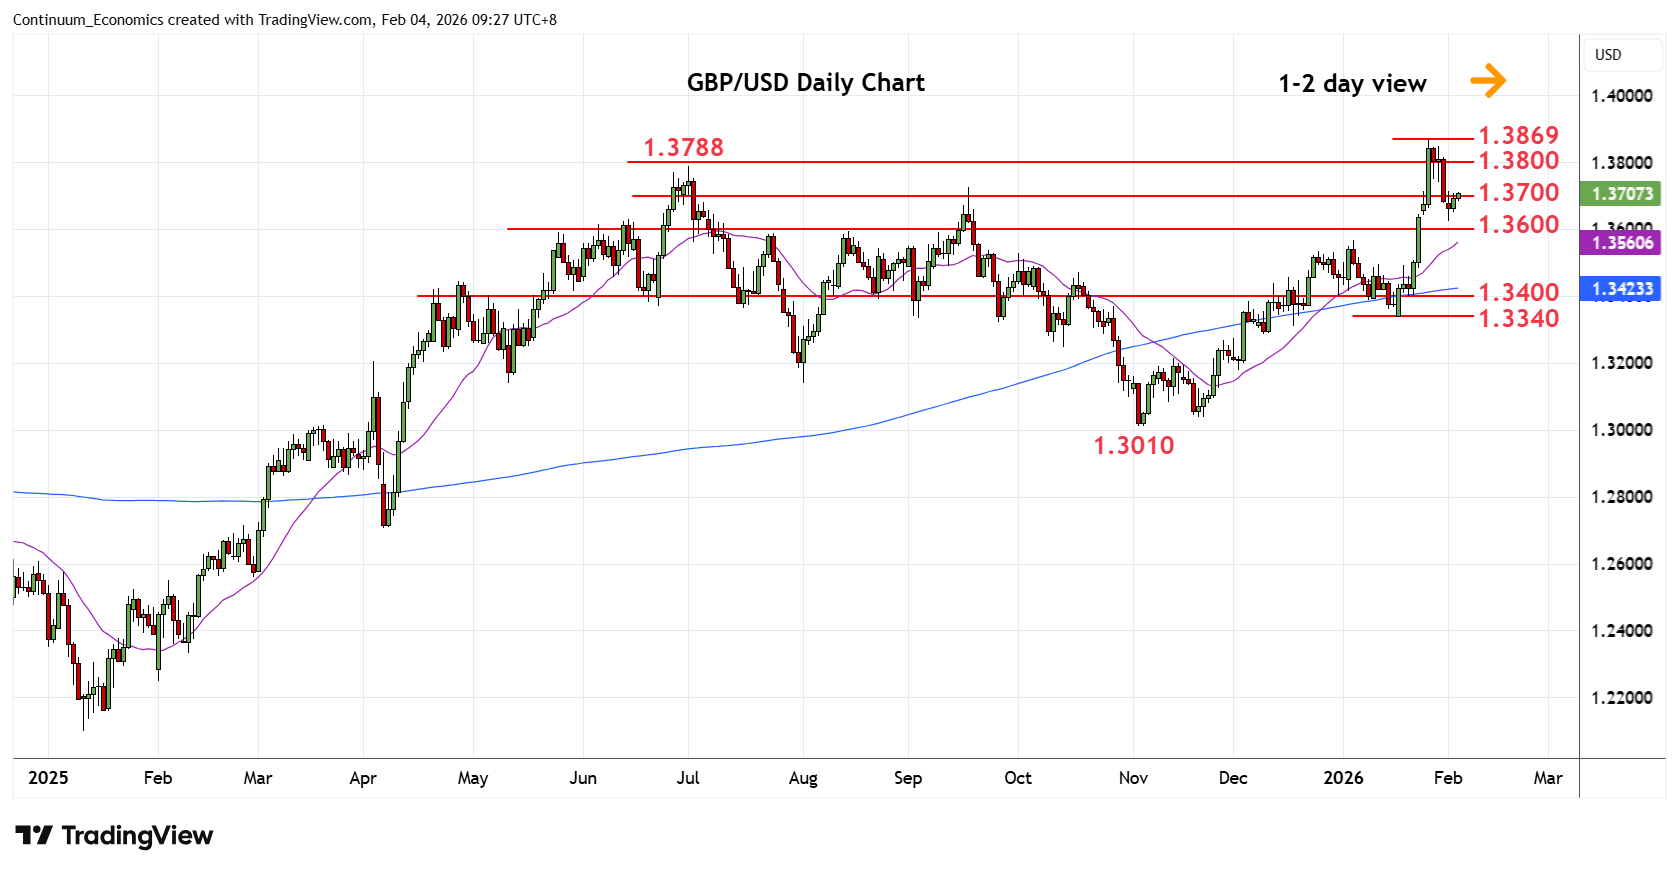
Higher in range from the Monday's 1.3623 low as prices consolidate pullback from the 1.3869 high
| Level | Comment | Level | Comment | |||||
|---|---|---|---|---|---|---|---|---|
| R4 | 1.3900/10 | * | congestion, Sep 2021 high | S1 | 1.3650 | * | congestion | |
| R3 | 1.3869 | ** | 27 Jan YTD high | S2 | 1.3623/00 | * | 2 Feb low, congestion | |
| R2 | 1.3788/00 | * | Jul high, congestion | S3 | 1.3568 | ** | 6 Jan high | |
| R1 | 1.3750 | * | congestion | S4 | 1.3500 | * | congestion |
Asterisk denotes strength of level
01:30 GMT - Higher in range from the Monday's 1.3623 low as prices consolidate pullback from the 1.3869 high. However, daily studies are tracking lower and deeper pullback cannot be ruled out though below the 1.3623 low see strong support at the 1.3600/1.3568 congestion and 6 January high expected to underpin. Correction is expected to give way to renewed buying interest later with resistance starting at the 1.3750 congestion. Regaining this will return focus to the upside for retest of the 1.3800 level then the 1.3869 January high.