Published: 2026-03-17T00:20:43.000Z
Chart AUD/USD Update: Range-bound in consolidation
1
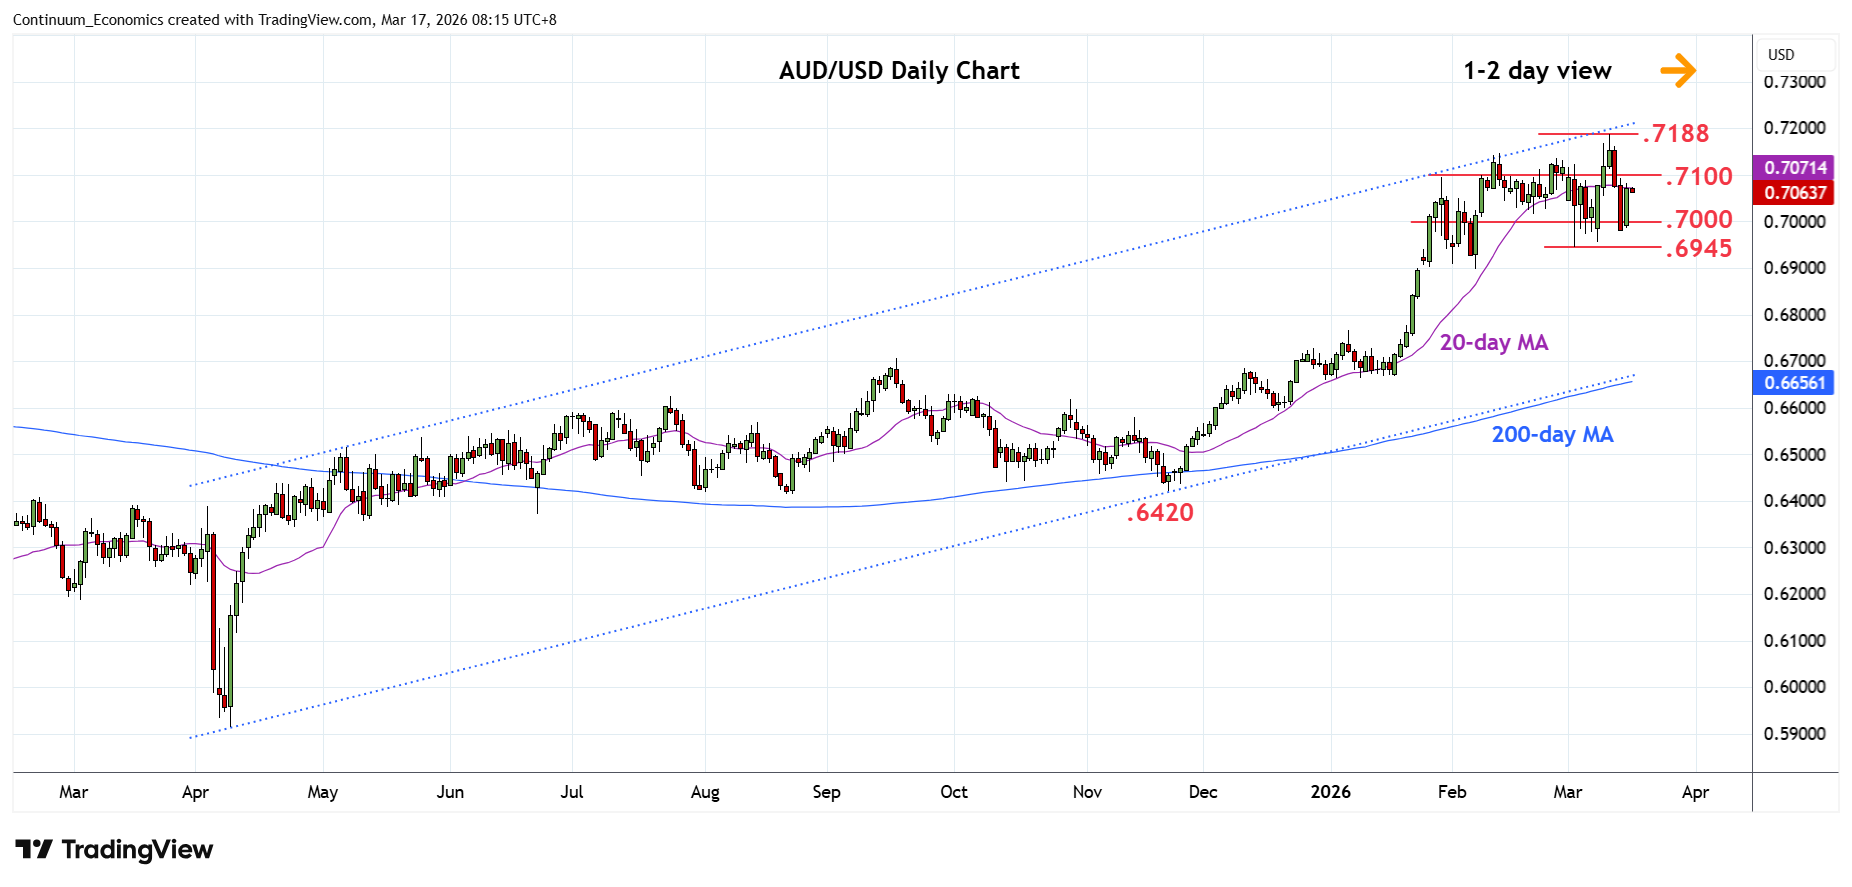
Turned up in range from the .6980 low as prices consolidate losses from the .7188 current year high
| Levels | Imp | Comment | Levels | Imp | Comment | |||
|---|---|---|---|---|---|---|---|---|
| R4 | 0.7200/10 | * | congestion, 61.8% | S1 | 0.6980 | * | 13 Mar low | |
| R3 | 0.7188 | ** | 11 Mar YTD high | S2 | 0.6945 | ** | 3 Mar low | |
| R2 | 0.7147 | ** | Feb high | S3 | 0.6900 | ** | Feb low, congestion | |
| R1 | 0.7100 | * | congestion | S4 | 0.6895 | * | 38.2% Nov/Mar rally |
Asterisk denotes strength of level
00:15 GMT - Turned up in range from the .6980 low as prices consolidate losses from the .7188 current year high. However, negative daily and weekly studies suggest consolidation giving way to renewed selling pressure later. Lower will see room to retest support at the .6945, 3 March low. Break here latter will see room for deeper pullback to retrace gains from the November low to the .6900 level and .6895, 38.2% Fibonacci level. Meanwhile, resistance remains at the .7100 congestion which is expected to cap. Break here, if seen, will return focus to the upside for retest of the .7147 and .7188 highs.