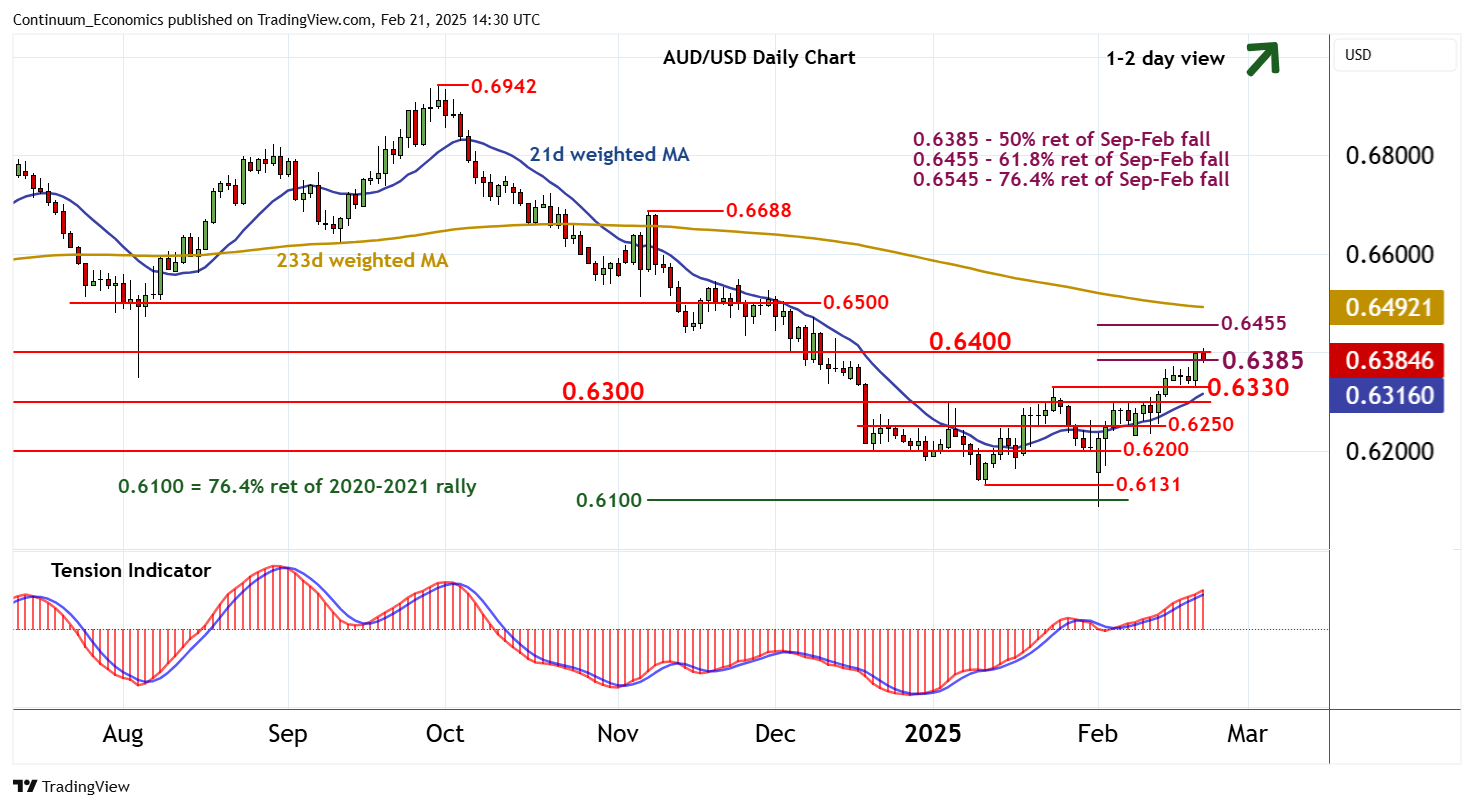
Chart AUD/USD Update: Pressuring 0.6385/00

The anticipated test of resistance at the 0.6385 Fibonacci retracement and the 0.6400 break level is giving way to consolidation
| Levels | Imp | Comment | Levels | Imp | Comment | |||
|---|---|---|---|---|---|---|---|---|
| R4 | 0.6500 | ** | break level | S1 | 0.6330 | * | 24 Jan (m) high | |
| R3 | 0.6455 | ** | 61.8% ret of Sep-Feb fall | S2 | 0.6300 | ** | congestion | |
| R2 | 0.6400 | ** | break level | S3 | 0.6250 | * | break level | |
| R1 | 0.6385 | ** | 50% ret of Sep-Feb fall | S4 | 0.6200 | ** | congestion |
Asterisk denotes strength of level
14:25 GMT - The anticipated test of resistance at the 0.6385 Fibonacci retracement and the 0.6400 break level is giving way to consolidation, as overbought intraday studies unwind, with prices currently balanced around 0.6385. Overbought daily stochastics are turning down, suggesting potential for a test beneath here. But the positive daily Tension Indicator and bullish weekly charts are expected to prompt renewed buying interest above support at the 0.6330 monthly high of 24 January. Following cautious trade, further gains are looked for. A close above 0.6400 will improve price action and extend February gains towards the 0.6455 retracement.