Published: 2025-04-25T07:30:42.000Z
Chart GBP/USD Update: Consolidating gains - studies under pressure

Senior Technical Strategist
1
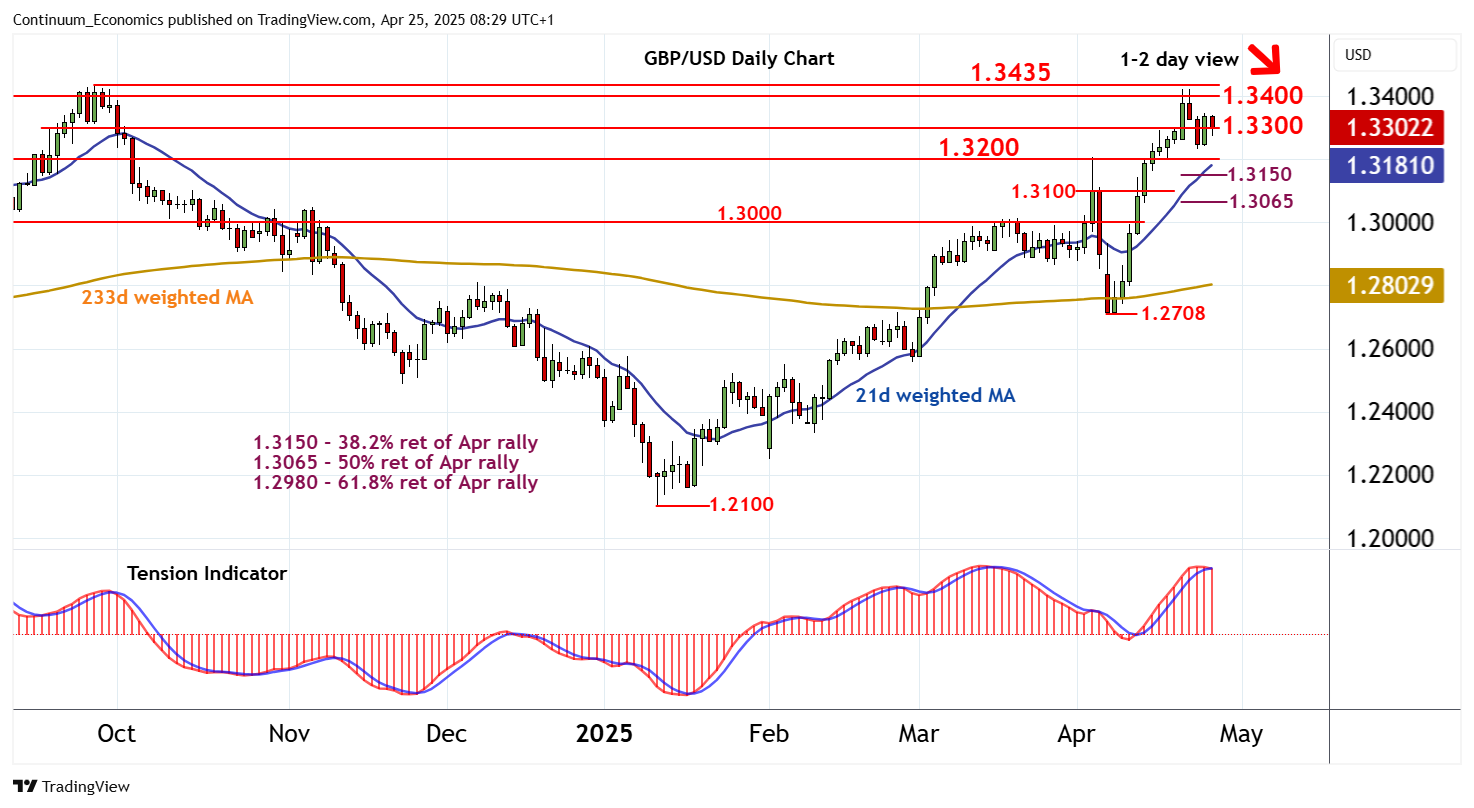
The test above 1.3300 has met anticipated selling interest below congestion around 1.3400
| Level | Comment | Level | Comment | |||||
|---|---|---|---|---|---|---|---|---|
| R4 | 1.3500 | ** | congestion | S1 | 1.3300 | range highs | ||
| R3 | 1.3435 | ** | 26 Sep 2024 (y) high | S2 | 1.3200 | ** | break level | |
| R2 | 1.3400 | historic congestion | S3 | 1.3150 | ** | 38.2% ret of Apr rally | ||
| R1 | 1.3350~ | 24 Apr high | S4 | 1.3100 | minor congestion |
Asterisk denotes strength of level
08:10 BST - The test above 1.3300 has met anticipated selling interest below congestion around 1.3400, as intraday studies turn down, with prices currently balanced in cautious trade around 1.3300. Daily stochastics continue to track lower, unwinding overbought areas, and the daily Tension Indicator is also under pressure, highlighting room for a break back below 1.3300 towards 1.3200. Still lower is the 1.3150 Fibonacci retracement. However, rising weekly charts are expected to prompt buying interest towards here. A break, if seen, will extend losses initially towards 1.3100.