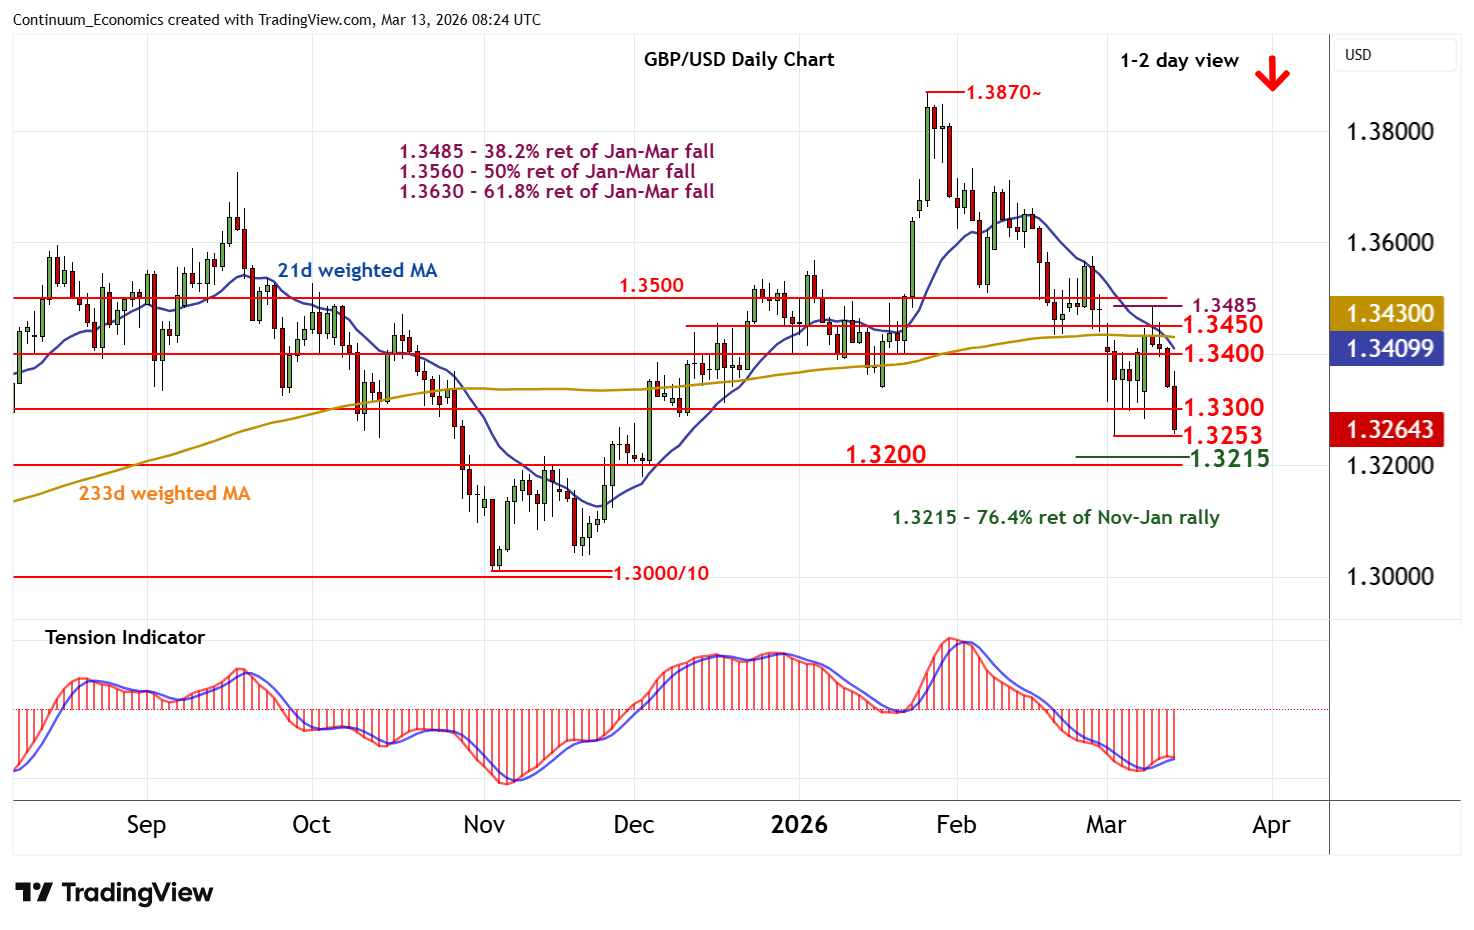
Chart GBP/USD Update: Focus on current year lows
Cautious trade around 1.3360~ has given way to anticipated selling interest
| Level | Comment | Level | Comment | |||||
|---|---|---|---|---|---|---|---|---|
| R4 | 1.3485 | * | 38.2% ret of Jan-Mar fall | S1 | 1.3253 | ** | 3 Mar YTD low | |
| R3 | 1.3450 | ** | congestion | S2 | 1.3215 | ** | 76.4% ret of Nov-Jan rally | |
| R2 | 1.3400 | ** | congestion | S3 | 1.3200 | ** | congestion | |
| R1 | 1.3300 | * | congestion | S4 | 1.3150 | congestion |
Asterisk denotes strength of level
08:10 GMT - Cautious trade around 1.3360~ has given way to anticipated selling interest, as intraday studies turn down, with sharp losses approaching strong support at the 1.3253 current year low of 3 March. Daily stochastics have turned down and the daily Tension Indicator is also bearish, highlighting room for a break and continuation of late-January losses towards the 1.3215 Fibonacci retracement. Daily stochastics are approaching oversold areas, suggesting any immediate tests could give way to short-covering/consolidation, before bearish weekly charts extend losses still further. Meanwhile, resistance is lowered to congestion around 1.3300. A close back above here, if seen, would help to stabilise price action and give way to fresh consolidation beneath further congestion around 1.3400.