Published: 2026-05-13T11:41:33.000Z
Chart USD/ZAR Update: Downside tests to remain limited
1
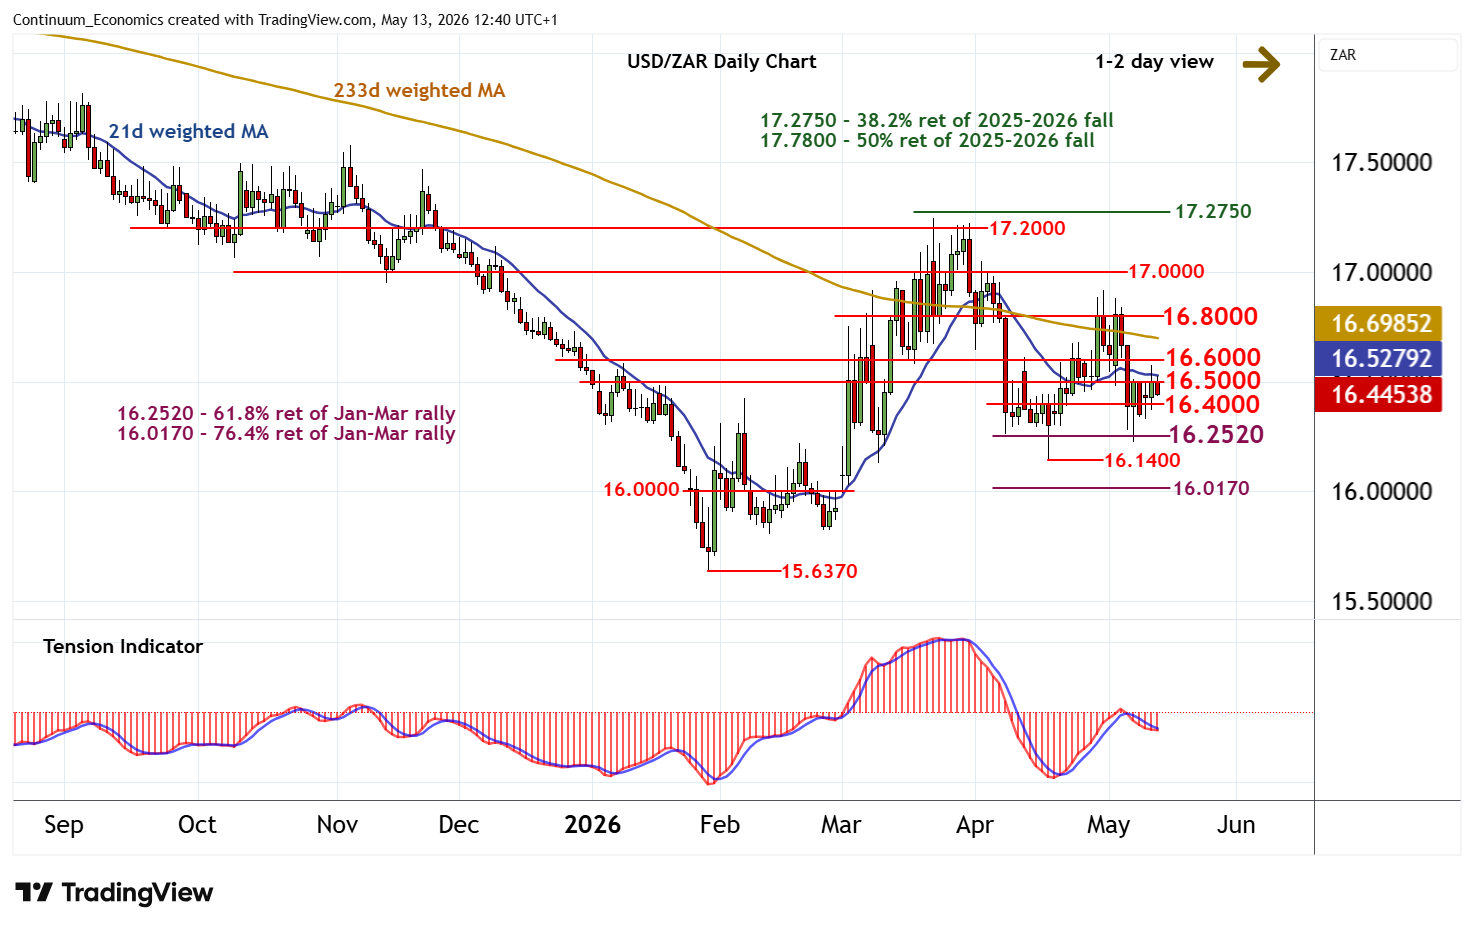
Cautious trade within the 16.5000 - 16.6000 resistance range has given way to a pullback
| Level | Comment | Level | Comment | |||||
|---|---|---|---|---|---|---|---|---|
| R4 | 17.0000 | * | congestion | S1 | 16.4000 | congestion | ||
| R3 | 16.8000 | * | congestion | S2 | 16.2520 | ** | 61.8% ret of Jan-Mar rally | |
| R2 | 16.6000 | break level | S3 | 16.1400 | * | 17 Apr (m) low | ||
| R1 | 16.5000 | break level | S4 | 16.0170 | ** | 76.4% ret of Jan-Mar rally |
Asterisk denotes strength of level
11:55 BST - Cautious trade within the 16.5000 - 16.6000 resistance range has given way to a pullback, as intraday studies turn down, with prices currently trading around 16.4450. Immediate focus is on congestion around 16.4000. But mixed daily readings should limit any initial tests in consolidation, before deteriorating weekly charts prompt further losses. A close beneath here will add weight to sentiment and open up a test of the 16.2520 Fibonacci retracement. Meanwhile, a close above 16.6000 would help to improve sentiment and open up a test of congestion resistance at 16.8000.