Published: 2025-12-22T00:28:16.000Z
Chart NZD/USD Update: Consolidating, but still heavy
-
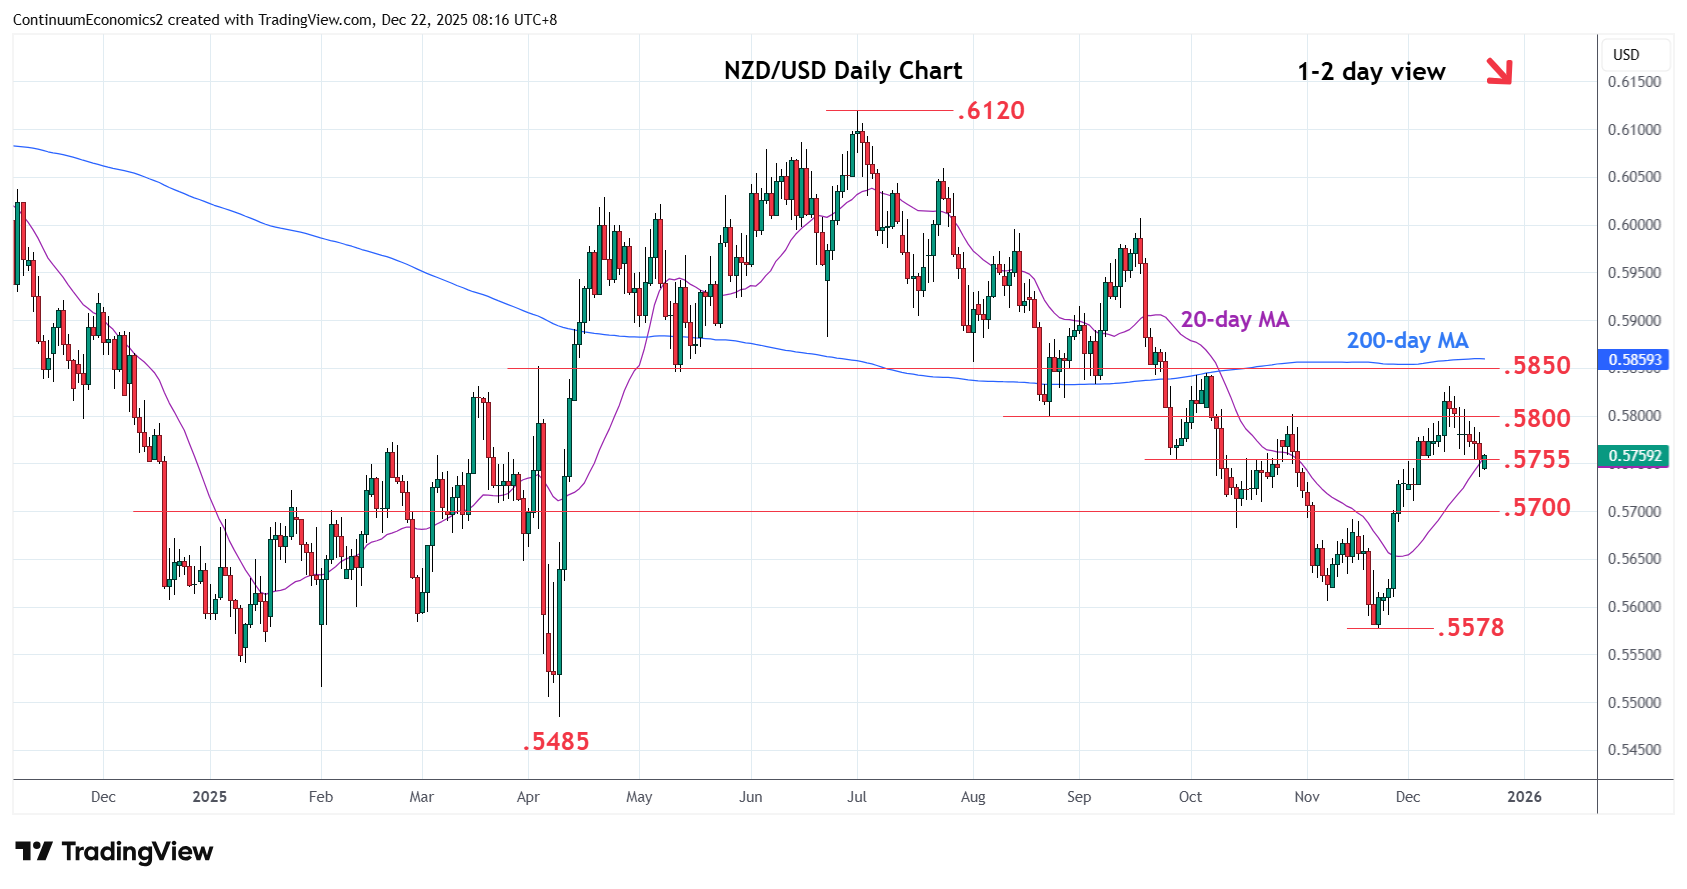
Break of support at the .5755/50 area has seen losses checked at .5735, 38.2% Fibonacci level
| Levels | Imp | Comment | Levels | Imp | Comment | |||
|---|---|---|---|---|---|---|---|---|
| R4 | .5910 | * | 61.8% Jul/Nov fall | S1 | .5735 | * | 38.2% Nov/Dec rally | |
| R3 | .5850/55 | ** | 50%, 1 Aug low | S2 | .5700/.5682 | ** | congestion, Oct low | |
| R2 | .5830 | ** | 11 Dec high | S3 | .5650 | * | congestion | |
| R1 | .5800 | * | congestion | S4 | .5606 | 7 Nov low |
Asterisk denotes strength of level
00:25 GMT - Break of support at the .5755/50 area has seen losses checked at .5735, 38.2% Fibonacci level. Consolidation here see prices unwinding oversold intraday studies but further losses cannot be ruled out to retrace rally from the .5578 November low. Lower will see potential to strong support at the .5700/.5682 area. Corrective pullback expected to give way to renewed buying interest later. Above resistance at the .5800 congestion and the .5830 high will see room for extension to strong resistance at the .5850/55, 50% Fibonacci level and 1st August low.