Published: 2026-05-20T15:17:21.000Z
Chart USD/CAD Update: Choppy trade - studies rising
1
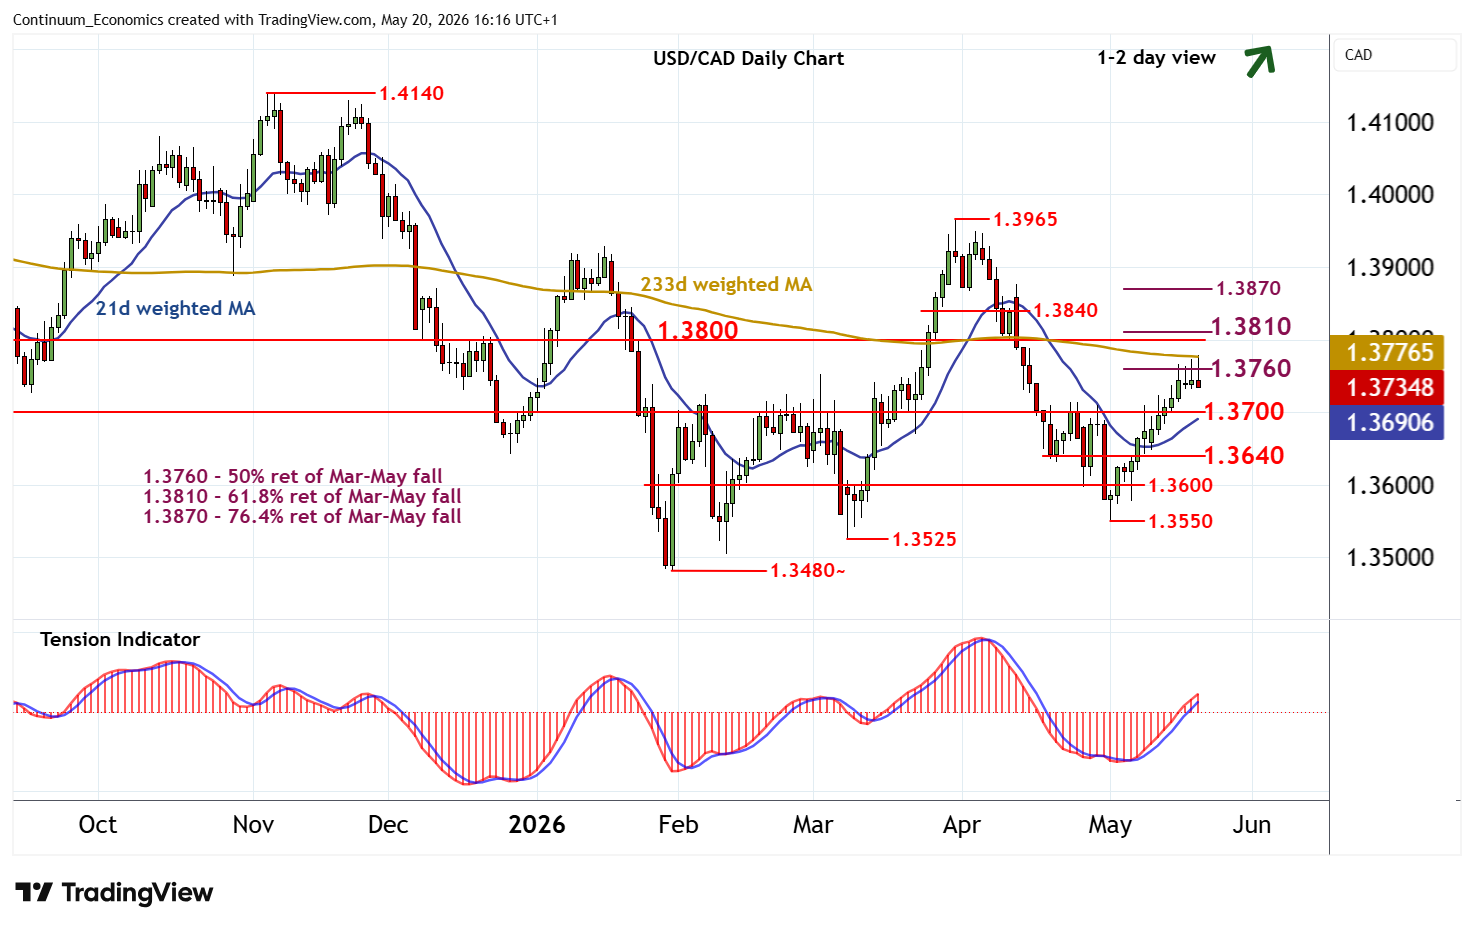
Still little change, as prices extend consolidation around resistance at the 1.3760 Fibonacci retracement
| Levels | Imp | Comment | Levels | Imp | Comment | |||
|---|---|---|---|---|---|---|---|---|
| R4 | 1.3870 | ** | 76.4% ret of Mar-May fall | S1 | 1.3700 | ** | congestion | |
| R3 | 1.3840 | intraday break level | S2 | 1.3640 | break level | |||
| R2 | 1.3800/10 | ** | congestion; 61.8% ret | S3 | 1.3600 | ** | congestion | |
| R1 | 1.3760 | ** | 50% ret of Mar-May fall | S4 | 1.3550 | * | 1 May (w) low |
Asterisk denotes strength of level
16:10 BST - Still little change, as prices extend consolidation around resistance at the 1.3760 Fibonacci retracement. The daily Tension Indicator continues to rise, highlighting room for a break above here towards strong resistance at 1.3800/10. But flat overbought daily stochastics could limit any immediate tests in consolidation, before improving weekly charts prompt further gains. Meanwhile, support remains at congestion around 1.3700. A close beneath here, if seen, would help to stabilise price action and prompt consolidation above 1.3640.