Published: 2026-01-29T00:26:27.000Z
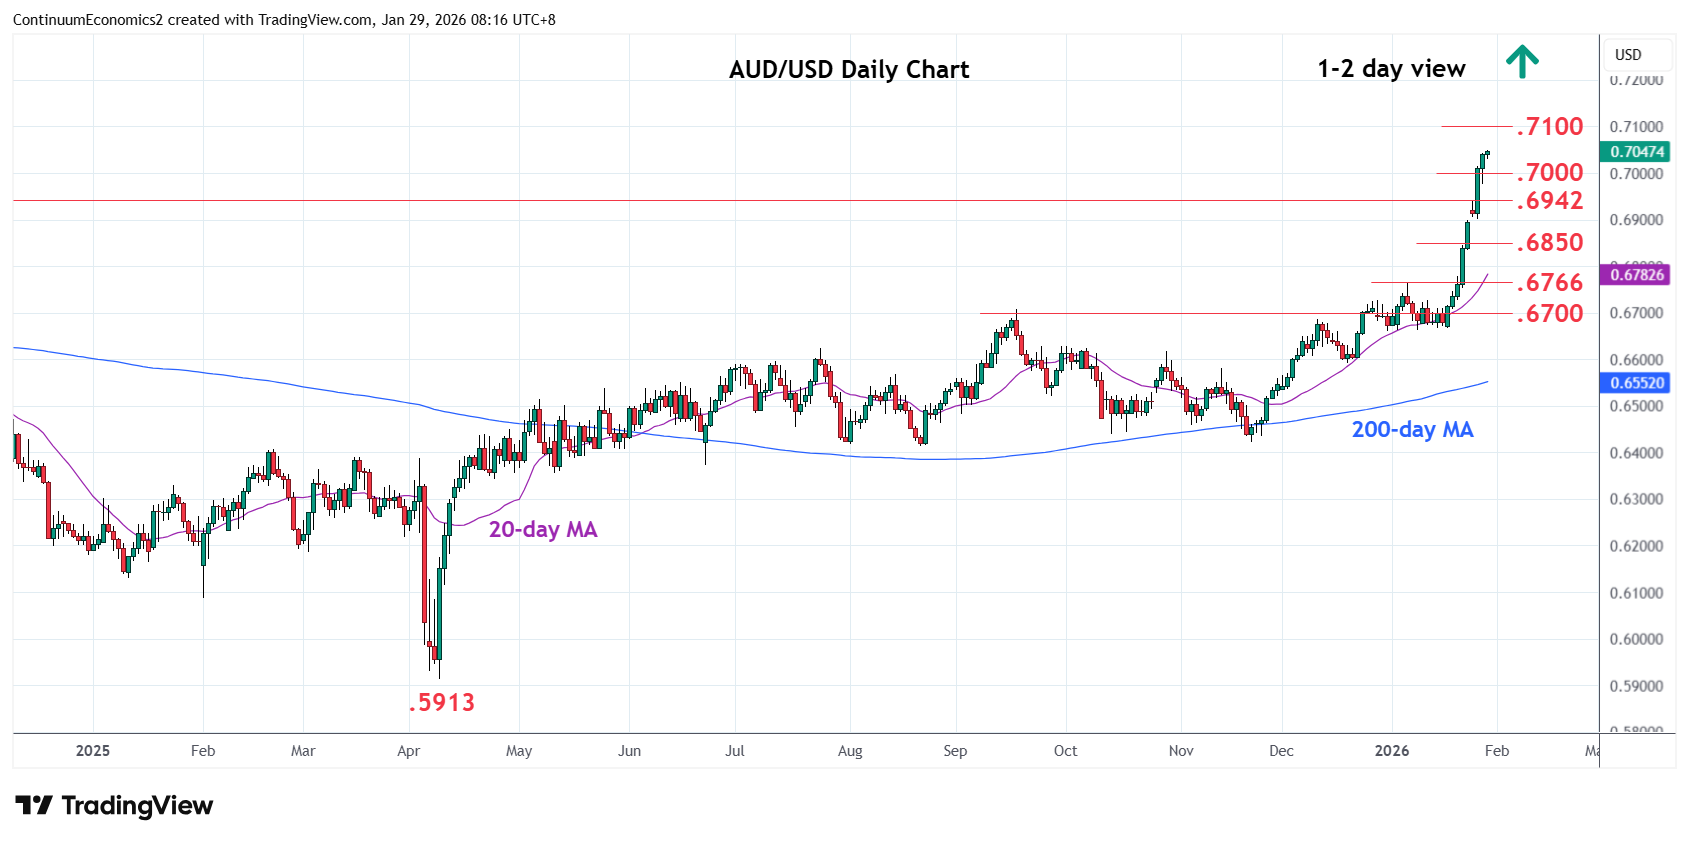
Chart AUD/USD Update: Extending gains above .7000
-
Pressure remains on the upside as prices extend gains above the .7000 level
| Levels | Imp | Comment | Levels | Imp | Comment | |||
|---|---|---|---|---|---|---|---|---|
| R4 | 0.7205 | * | 50% 2021/2025 fall | S1 | 0.7000 | * | figure | |
| R3 | 0.7158 | ** | Feb 2023 year high | S2 | 0.6942 | * | 2024 year high | |
| R2 | 0.7100 | * | congestion | S3 | 0.6900 | ** | 23 Jan high, gap | |
| R1 | 0.7050 | * | congestion | S4 | 0.6850/00 | * | congestion |
Asterisk denotes strength of level
00:15 GMT - Pressure remains on the upside as prices extend gains above the .7000 level. Nearby see room to the .7050/.7100 congestion area as prices retrace losses from the February 2021 year high. Higher still, will see room to 2023 year high at .7158 and .7205, 50% Fibonacci level. However, overbought daily and weekly studies caution corrective pullback with support now raised to the .7000 figure. Below this will open up room for deeper pullback in consolidation to support at .6942/.6900, the 2024 year high and Friday's high and gap area.