Chart AUD/USD Update: Balanced

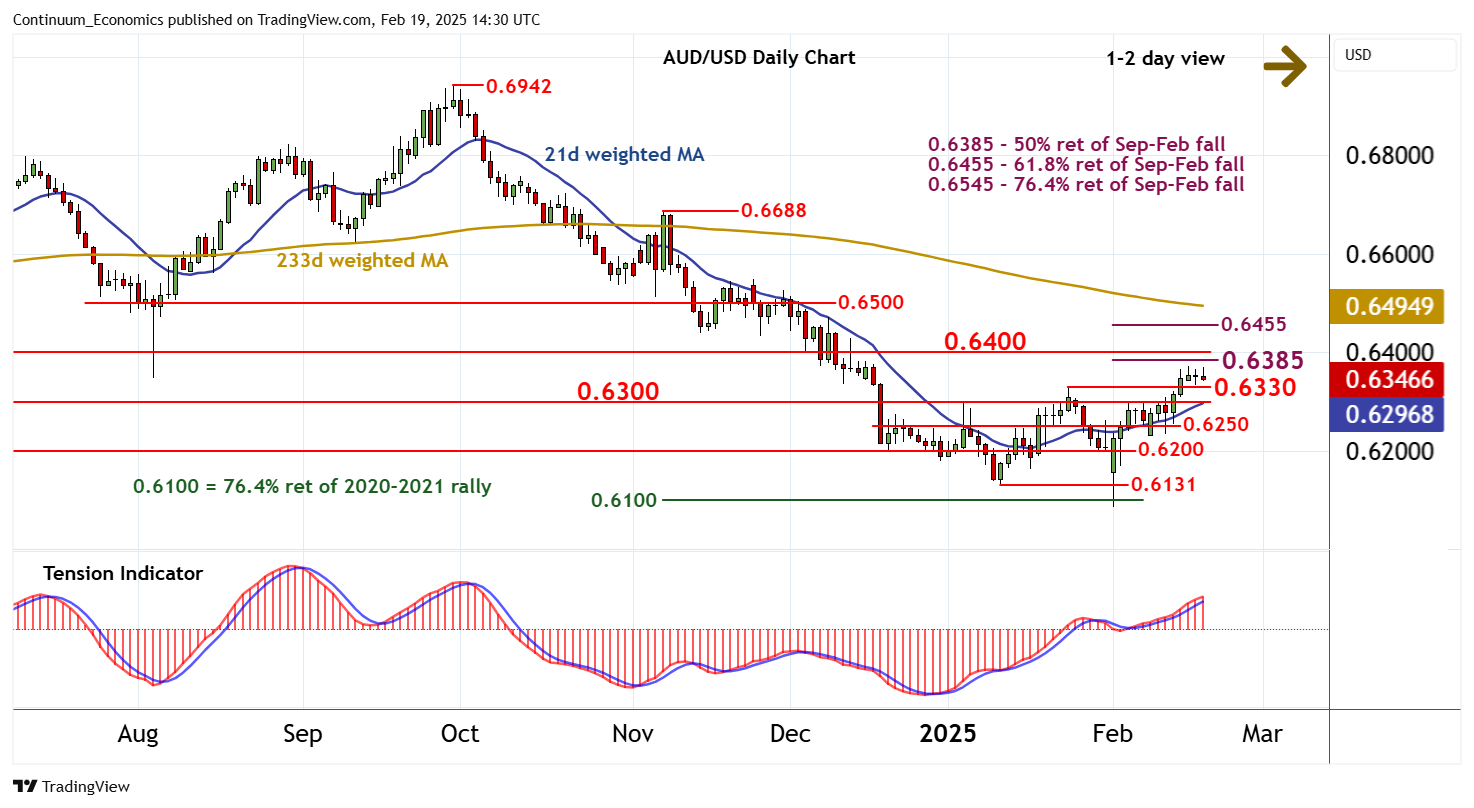
Still little change, as prices extend cautious trade above support at 0.6330
| Levels | Imp | Comment | Levels | Imp | Comment | |||
|---|---|---|---|---|---|---|---|---|
| R4 | 0.6500 | ** | break level | S1 | 0.6330 | * | 24 Jan (m) high | |
| R3 | 0.6455 | ** | 61.8% ret of Sep-Feb fall | S2 | 0.6300 | ** | congestion | |
| R2 | 0.6400 | ** | break level | S3 | 0.6250 | * | break level | |
| R1 | 0.6385 | ** | 50% ret of Sep-Feb fall | S4 | 0.6200 | ** | congestion |
Asterisk denotes strength of level
14:30 GMT - Still little change, as prices extend cautious trade above support at 0.6330. Intraday studies are turning down and overbought daily stochastics are flattening, suggesting room for a test beneath here towards congestion around 0.6300. However, the positive daily Tension Indicator and bullish weekly charts are expected to prompt fresh buying interest around here. A close below 0.6300, however, will open up 0.6250, where renewed consolidation is looked for. Meanwhile, resistance remains at the 0.6385 Fibonacci retracement and 0.6400 break level. A later close above here will further improve sentiment and extend February gains towards the 0.6455 retracement.