Chart NZD/USD Update: Bear flag threatens above the .5775 low
Extend rejection from the .5890 high of last week with choppy trade tracing out a bear flag from the .5775, 13 March low
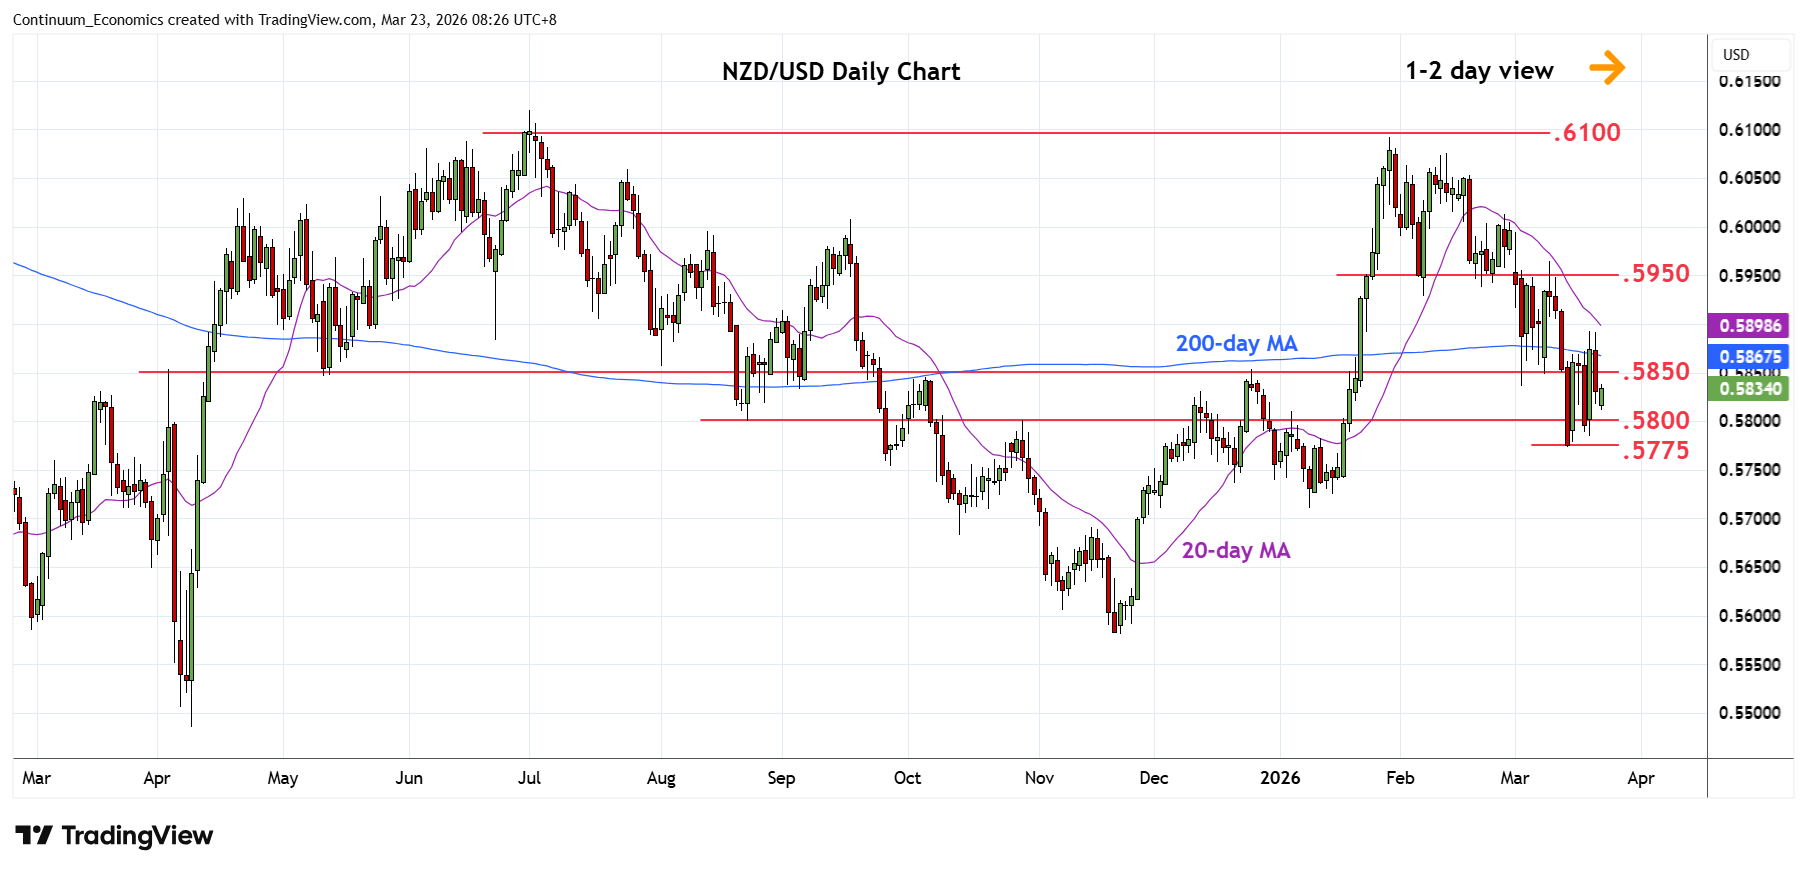
| Levels | Imp | Comment | Levels | Imp | Comment | |||
|---|---|---|---|---|---|---|---|---|
| R4 | .6000/30 | * | congestion, 26 Feb high | S1 | .5800 | * | congestion | |
| R3 | .5930/50 | ** | 6 Feb low, congestion | S2 | .5775 | * | 61.8% Nov/Jan rally | |
| R2 | .5900 | * | congestion | S3 | .5710 | ** | 9 Jan YTD low | |
| R1 | .5850 | * | congestion | S4 | .5700 | * | 76.4% Nov/Jan rally |
Asterisk denotes strength of level
00:30 GMT - Extend rejection from the .5890 high of last week with choppy trade tracing out a bear flag from the .5775, 13 March low. Negative daily studies suggest scope for pullback to retest the .5800 level then the .5775 low and 61.8% Fibonacci level. Break here will extend losses from the .6093 January current year high and see deeper pullback to .5750 congestion and .5710/00, January low and 76.4% Fibonacci level. Meanwhile, resistance is lowered to .5850 congestion and this extend to the .5890 high of last week. Break here, if seen, will open up room for extension to strong resistance at the .5930/50 area.