Published: 2025-06-23T00:18:21.000Z
Chart AUD/USD Update: Under pressure as prices extend break of wedge pattern

Technical Analyst
2
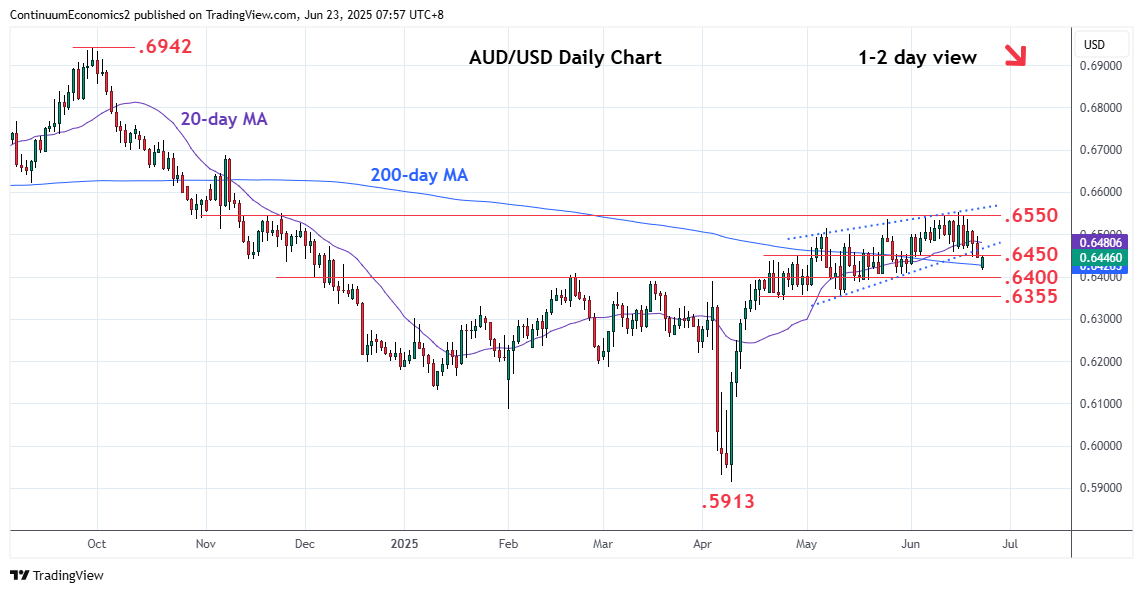
Under pressure, as prices extend break of the wedge pattern and .6450 support
| Levels | Imp | Comment | Levels | Imp | Comment | |||
|---|---|---|---|---|---|---|---|---|
| R4 | 0.6600 | * | congestion | S1 | 0.6400 | * | congestion | |
| R3 | 0.6550 | ** | 61.8% Sep/Apr fall | S2 | 0.6355/50 | ** | May low, Aug 2024 low | |
| R2 | 0.6500 | * | congestion | S3 | 0.6305 | * | 38.2% Apr/Jun rally | |
| R1 | 0.6450 | * | congestion | S4 | 0.6260/50 | * | congestion |
Asterisk denotes strength of level
00:10 GMT - Under pressure, as prices extend break of the wedge pattern and .6450 support. Nearby see room to strong support at .6400 congestion. Daily and weekly studies are tracking lower from overbought area and see risk for break here to open up room to the .6355/50 May low and August 2024 low. Lower still will see room to .6305, 35.2% Fibonacci level. Meanwhile, resistance is lowered to the .6450 congestion which is expected to cap and sustain losses from the .6550 high and 61.8% Fibonacci level.