Published: 2026-03-09T16:56:13.000Z
Chart USD/CAD Update: Consolidating test lower - studies under pressure
1
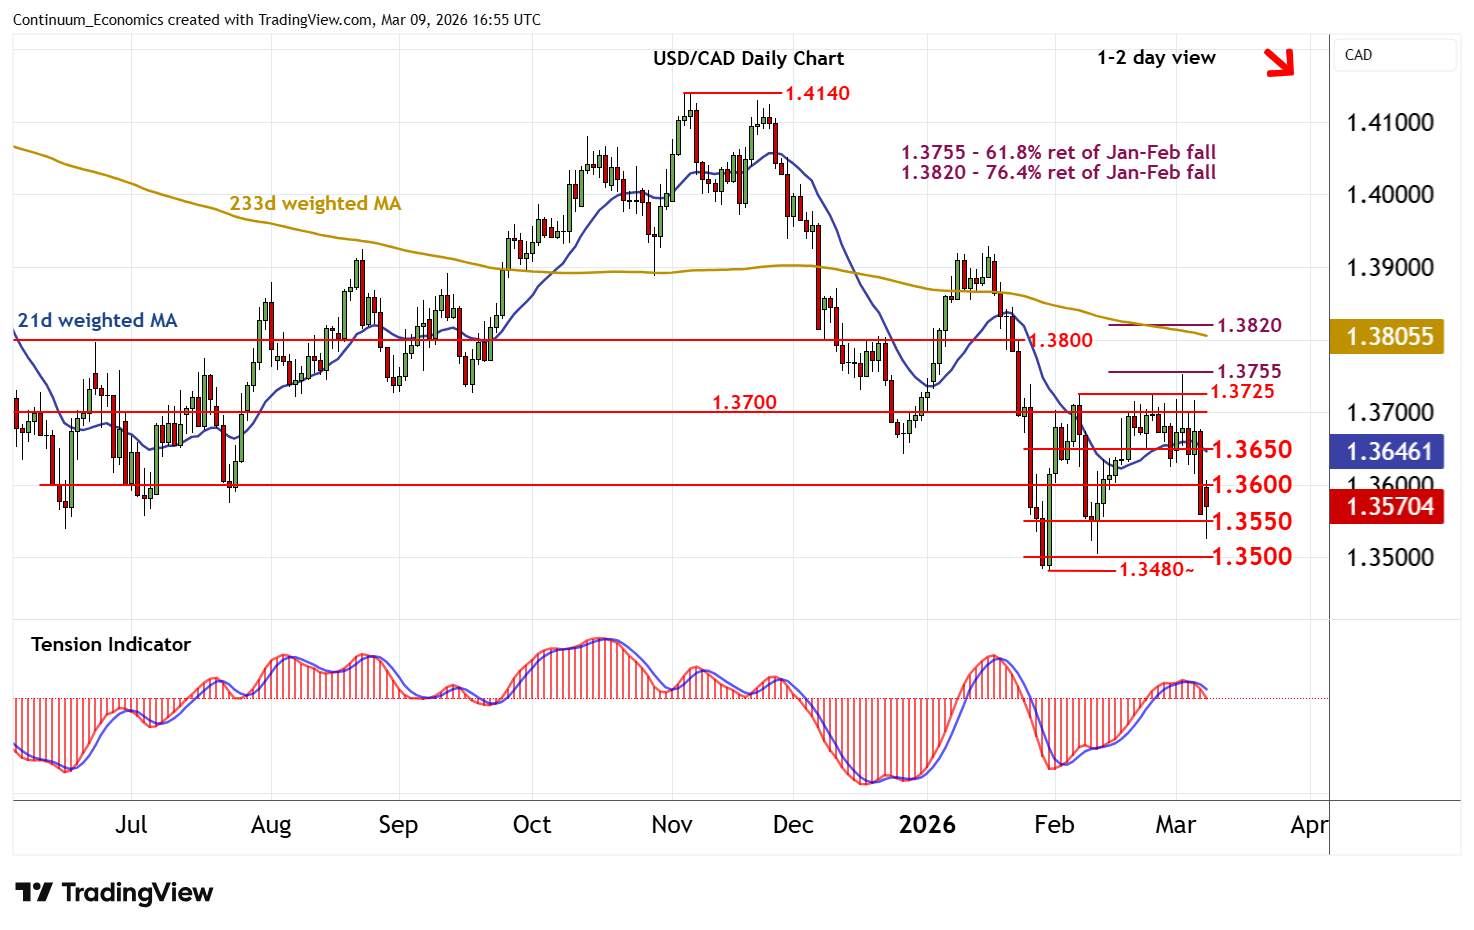
The anticipated break below 1.3550 has bounced from 1.3525
| Levels | Imp | Comment | Levels | Imp | Comment | |||
|---|---|---|---|---|---|---|---|---|
| R4 | 1.3725 | * | 6 Feb (m) high | S1 | 1.3550 | congestion | ||
| R3 | 1.3700 | * | congestion | S2 | 1.3500 | ** | congestion | |
| R2 | 1.3650 | congestion | S3 | 1.3480~ | ** | 30 Jan YTD low | ||
| R1 | 1.3600 | * | congestion | S4 | 1.3420 | ** | September 2024 low |
Asterisk denotes strength of level
16:45 GMT - The anticipated break below 1.3550 has bounced from 1.3525, as oversold intraday studies unwind, with prices currently trading around 1.3565. Daily readings continue to track lower and broader weekly charts are also bearish, highlighting room for a later break back beneath here towards strong support at the 1.3480~ current year low of 30 January and congestion around 1.3500. By-then oversold daily stochastics could limit any initial tests in consolidation, before further losses unfold. Meanwhile, resistance is lowered to congestion around 1.3600 and extends to 1.3650. This range should cap any immediate tests higher.