Published: 2025-09-12T02:37:15.000Z
Chart USD/SGD Update: Leaning lower in consolidation
0
-
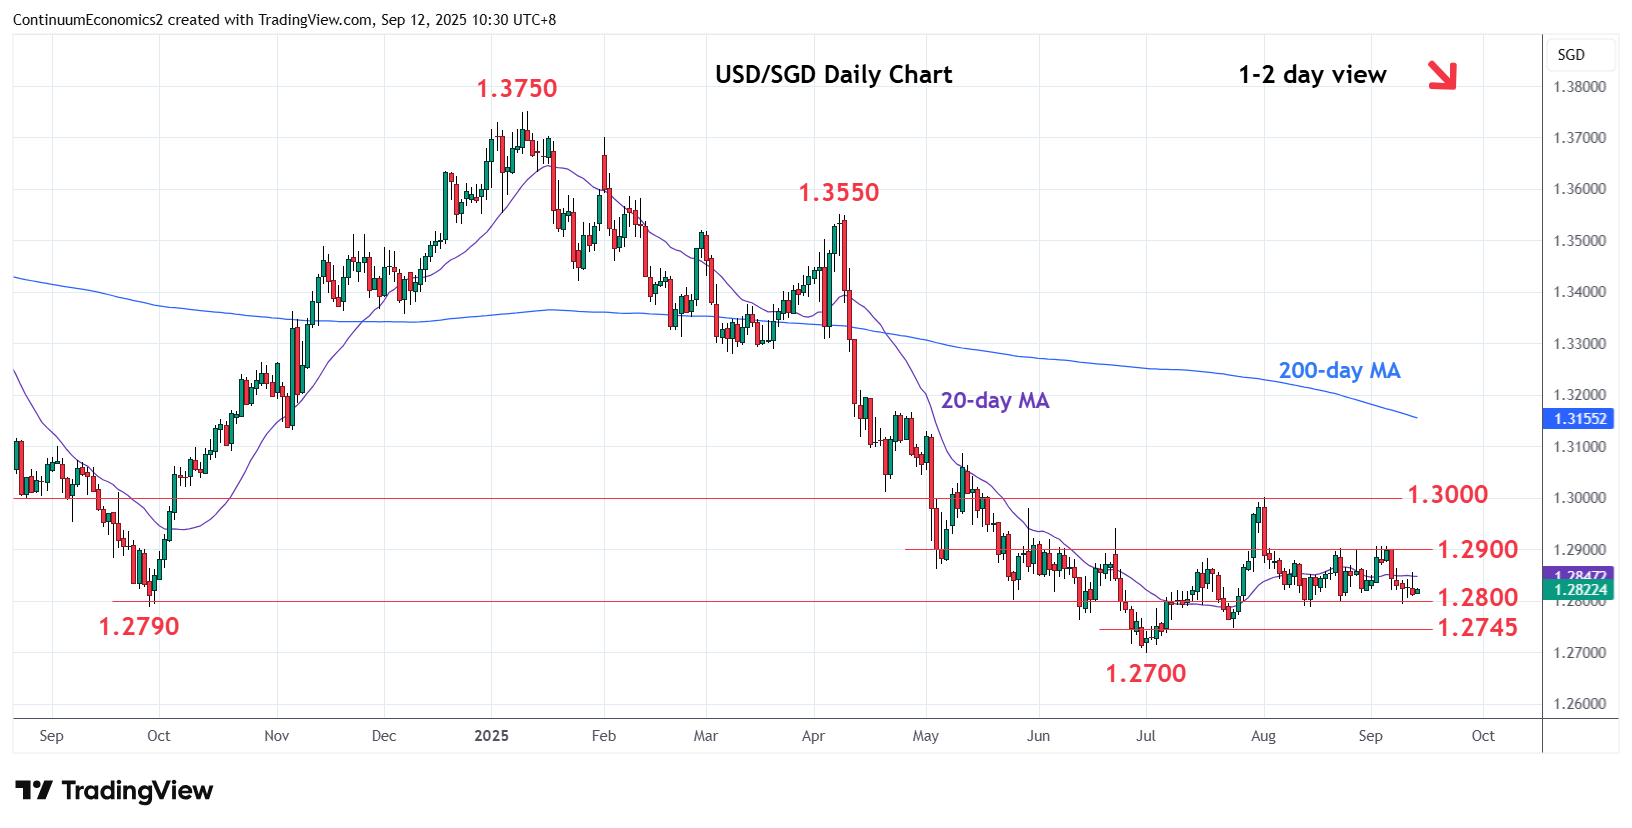
Leaning lower in consolidation above support at the 1.2800/1.2790, August and 2024 year lows
| Level | Comment | Level | Comment | ||||
|---|---|---|---|---|---|---|---|
| R4 | 1.3000/10 | ** | Aug high, 21 Apr low | S1 | 1.2800/90 | * | Aug, 2024 year lows |
| R3 | 1.2940 | * | Jun high | S2 | 1.2745 | * | 24 Jul low |
| R2 | 1.2900 | ** | congestion | S3 | 1.2700 | ** | 1 Jul YTD low |
| R1 | 1.2850 | * | congestion | S4 | 1.2650 | * | congestion |
Asterisk denotes strength of level
02:30 GMT - Leaning lower in consolidation above support at the 1.2800/1.2790, August and 2024 year lows. The resulting flag pattern threatens break here to extend pullback from the 1.2900 range high. Lower will extend the broader losses from the 1.3000, August swing high, and see room to the 1.2745 support. Below this will see potential for retest the 1.2700, July current year low. Meanwhile, resistance at the 1.2850/60 congestion area is expected to cap and sustain losses from the 1.2900 congestion.