Published: 2025-07-21T15:37:10.000Z
Chart USD/CAD Update: Leaning lower

Senior Technical Strategist
-
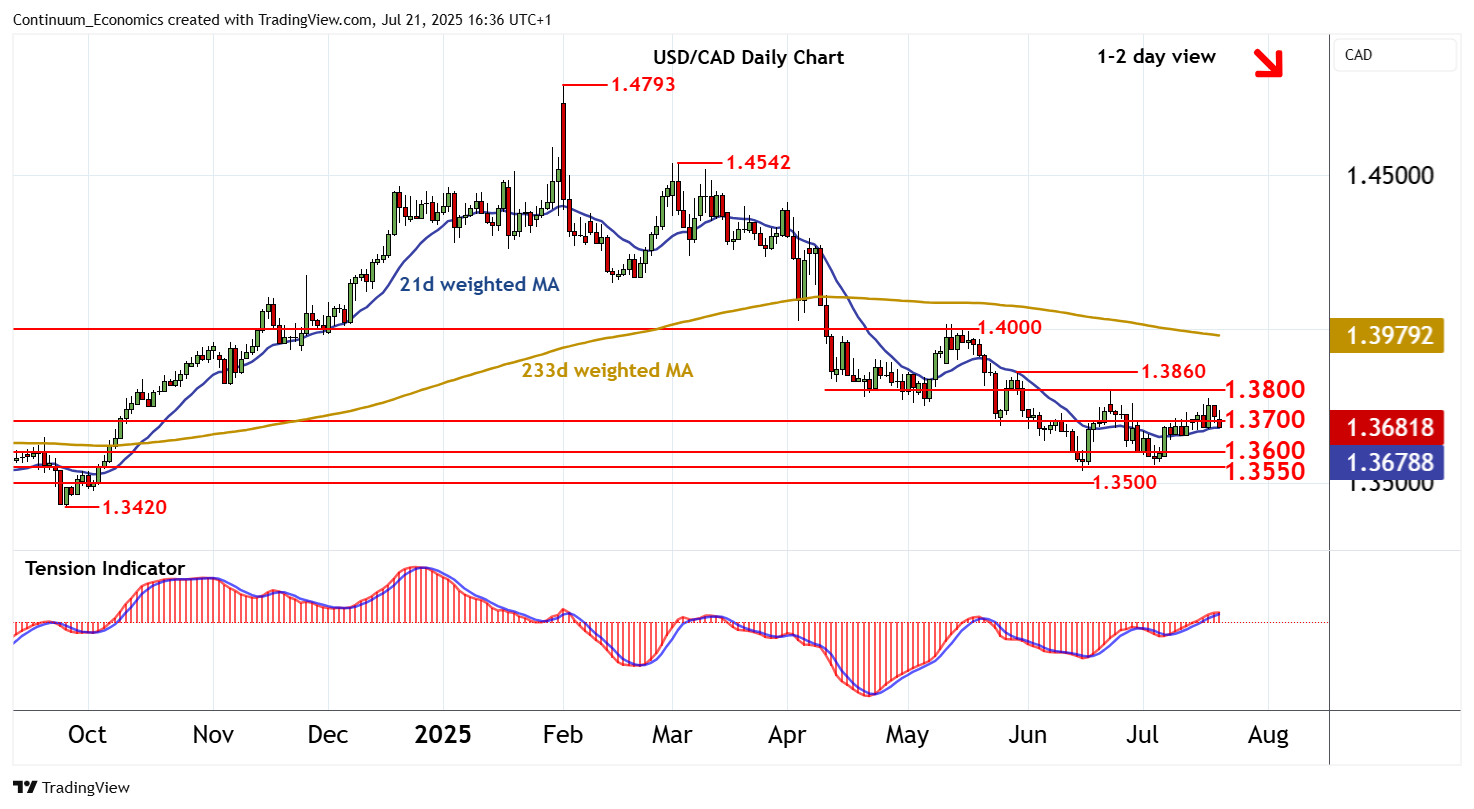
Consolidation around 1.3700 is giving way to the anticipated break
| Levels | Imp | Comment | Levels | Imp | Comment | |||
|---|---|---|---|---|---|---|---|---|
| R4 | 1.3900 | * | break level | S1 | 1.3600 | ** | congestion | |
| R3 | 1.3860 | * | 29 May (w) high | S2 | 1.3550 | * | congestion | |
| R2 | 1.3800 | * | congestion | S3 | 1.3500 | * | congestion | |
| R1 | 1.3700 | ** | congestion | S4 | 1.3420 | ** | 25 Sep (m) low |
Asterisk denotes strength of level
16:20 BST - Consolidation around 1.3700 is giving way to the anticipated break, with prices currently trading around 1.3680. Intraday studies are negative and daily readings are tracking lower, highlighting room for a test of congestion support at 1.3600. Beneath here is further congestion around 1.3550. But rising weekly charts should limit any tests of here in renewed buying interest/consolidation. Meanwhile, a close back above 1.3700 would help to stabilise price action and prompt consolidation beneath congestion around 1.3800.